Mating ground for North Atlantic right whales discovered in the Gulf of Maine
by Hannah Calich, RJD Graduate Student and Intern
North Atlantic right whales (Eubalaena glacialis) are among the most endangered species of marine mammals in the world. Their Endangered status is largely due to the fact that they were heavily targeted by the whaling industry for over 300 years. During that time it is estimated that somewhere between 5,500 and 11,000 North Atlantic right whales were removed (Reilly et al., 2012). Currently, there are approximately 500 individuals left in the world (Pettis, 2012).
Despite the fact that these animals have been classified as Endangered since 1984 they are not recovering well (Reilly et al., 2012). Both biological and anthropogenic factors are influencing the North Atlantic right whale’s recovery. The primary biological factors hindering recovery are a lack of reproductively capable females, a slow growth rate, and low genetic diversity in the population. The primary anthropogenic factors include vessel strikes and entanglement in fishing gear. Efforts to mitigate the anthropogenic factors include moving shipping lanes out of migration routes and modifying gear to reduce entanglement.
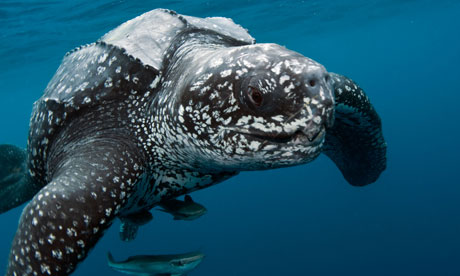
Despite the fact that there has been intensive research on the North Atlantic right whale for over 30 years their mating grounds have remained a mystery, until recently. Timothy Cole et al. (2013) used observations from aerial surveys to monitor the distribution of North Atlantic right whales and help determine their mating grounds. Surveys were conducted along the eastern coast of the US and Canada between 2002 and 2008. When whales were sighted each whale was photographed to aid in identification. North Atlantic right whales are unique from other whale species in that each whale has a distinct pattern of callosities on its head that helps researchers identify individual animals (Figure 1).

Figure 1 – The left side of a North Atlantic right whale’s head. This whale was sighted in the Bay of Fundy, Canada during August 2010. This animal was identified as a North Atlantic right whale based on its exaggerated lower jaw and the brown/grey callosities on top of its head. Photo by: Hannah Calich
The North Atlantic Right Whale Catalog is used to identify individual whales. The catalog consists of over 200,000 photographs and has been ongoing since 1935 (New England Aquarium, 2013). Each record indicates when and where a whale was last sighted, who saw it, and any additional information (e.g., the sex of the whale). Cole et al. (2013) identified fertile females based on their close association with a calf (Knowlton et al., 1994) and fertile males based on previous genetic analyses and paternity testing.
To determine the most likely location for mating Cole et al. (2013) examined where fertile males and females congregated during the mating season. Since the exact mating season for North Atlantic right whales has not been determined researchers made inferences based on observations of a close relative, the southern right whale (Eubalaena australis; Best, 1994). Additional cues about when North Atlantic right whales mate included observations of when and where their newborn calves are found, the predicted gestation period of the mother, and observations of courtship behaviors. When these observations were combined Cole et al. (2013) hypothesized that the mating season for the North Atlantic right whale falls between November and February.
Between November and February fertile male and female North Atlantic right whales form large aggregations in the central Gulf of Maine; suggesting that this is likely a mating ground for the species (Figure 2). In addition to finding a potential mating ground researchers also determined that the fertile females observed in this aggregation came from two separate subpopulations. This observation supports the idea that the entire North Atlantic right whale population may come to the central Gulf of Maine to mate.
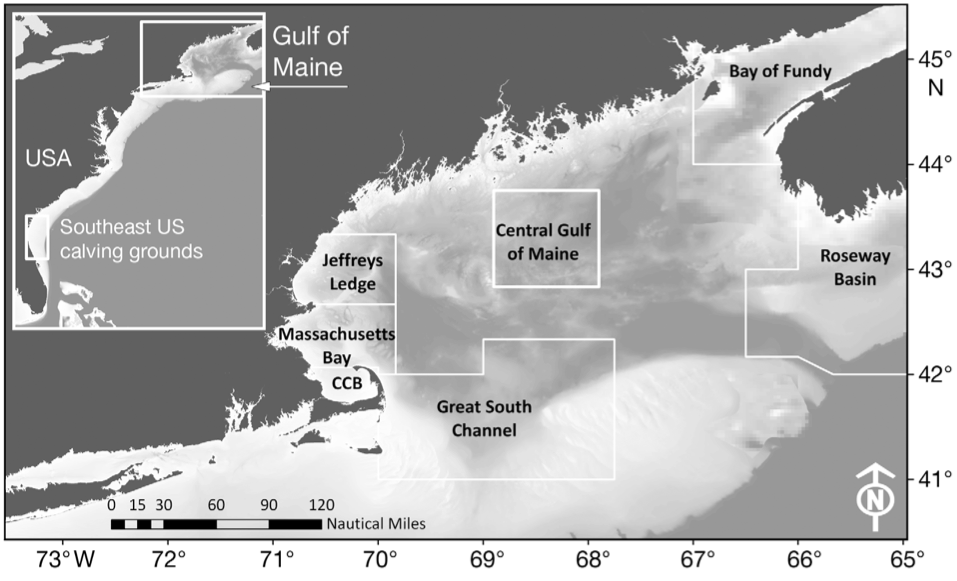
Figure 2 – Regions seasonally occupied by the North Atlantic right whale (Cole et al., 2013).
Cole et al. (2013) also recorded high numbers of fertile individuals in Roseway Basin. However, the Roseway Basin aggregation occurred 1-2 months before the central Gulf of Maine aggregation. Since the mating period for North Atlantic right whales has not been confirmed it is possible that in comparison to southern right whales, North Atlantic right whales may have a longer gestation period. If that is the case, Roseway Basin may also be a mating ground for the North Atlantic right whale.
Food availability may be one of the most important factors in determining where mating will occur (Cole et al., 2013). Social factors such as feeding area preference may also play an important role. If food availability helps determine mating grounds, the mating location may change in response to changing food conditions. A longer time series of data is required to determine if the mating grounds change in response to changing prey availability.
The recovery of North Atlantic right whales largely depends on successful reproduction. Unfortunately, the current reproduction rate is very low. By working to determine when North Atlantic right whales mate and why they decide to mate where they do, researchers are taking important steps toward protecting this Endangered from Extinction.
REFERENCES
Best, P.B. (1994) Seasonality of reproduction and the length of gestation in southern right whales, Eubalaena australis. J Zool (Lond) 232:175−189
Cole, T.V.N., Hamilton, P., Henry, A.G., Duley, P., Pace III, R.M., White, B.N., Frasier, T. (2013) Evidence of a North Atlantic right whale Eubalaena glacialis mating ground. Endang Species Res 21:55−64
Knowlton, A.R., Kraus, S.D., Kenney, R.D. (1994) Reproduction in North Atlantic right whales (Eubalaena glacialis). Can J Zool 72:1297−1305
New England Aquarium (2013) North Atlantic Right Whale Catalog. http://rwcatalog.neaq.org/Terms.aspx (accessed October 2013)
Pettis, H. (2012) North Atlantic Right Whale Consortium 2012 annual report card. Report to the North Atlantic Right Whale Consortium, November 2012. www.narwc.org/ pdf/2012_Report_Card.pdf (accessed October 2013)
Reilly, S.B., Bannister, J.L., Best, P.B., Brown, M., Brownell Jr., R.L., Butterworth, D.S., Clapham, P.J., Cooke, J., Donovan, G., Urbán, J. & Zerbini, A.N. (2012) Eubalaena glacialis. In: IUCN 2013. IUCN Red List of Threatened Species. Version 2013.1. www.iucnredlist.org (accessed October 2013)