DNA Barcoding: What is it and how can it help stranded marine mammals?

By Hannah Calich, RJD Graduate Student and Intern

Prior to 2003, when someone wanted to identify a biological specimen they would examine its morphological features (such as the shape, size, or colour of specific body parts). However, identification wasn’t possible with degraded specimens. To combat this, in 2003 Paul Hebert proposed “DNA barcoding” as a way to help identify animals without using morphological measurements (CBOL, 2014).

DNA barcoding uses small pieces of the genetic sequence obtained from a specimen’s DNA sample to determine what species the sample came from. Since the pieces all come from the same area within the DNA sequence, they can be compared to help determine the animal’s species. This concept is similar to how barcodes are used at the grocery store. To the untrained eye all barcodes look very similar, but scanners are able to identify distinct patterns in the barcode and tell the cashier what the product is. To date, over 140,000 animals, 52,000 plants, and 15,000 Fungi and other life forms have had their DNA catalogued for barcoding (CBOL, 2014).

The implications of DNA barcoding extend well beyond simply creating a database. In fact, a recent study by Alfonsi et al. (2013) aimed to investigate the feasibility of using DNA barcoding to help monitor marine mammal biodiversity through strandings along the French Atlantic coast. In the last 10 years over 1,500 marine mammals from 19 different species have stranded along the French Atlantic coast (Figure 1). Unfortunately, 16.8% of the animals (258 animals) could not be identified to the species level due to body decomposition (Figure 2), poor weather conditions, or because the animal was very rare. Identifying these unknown species is important to help researchers determine what species are stranding, where they are stranding, and what (if anything) humans can do to help save these animals.

Calich_RJD_Blog_DNAbarcoding_Fig1

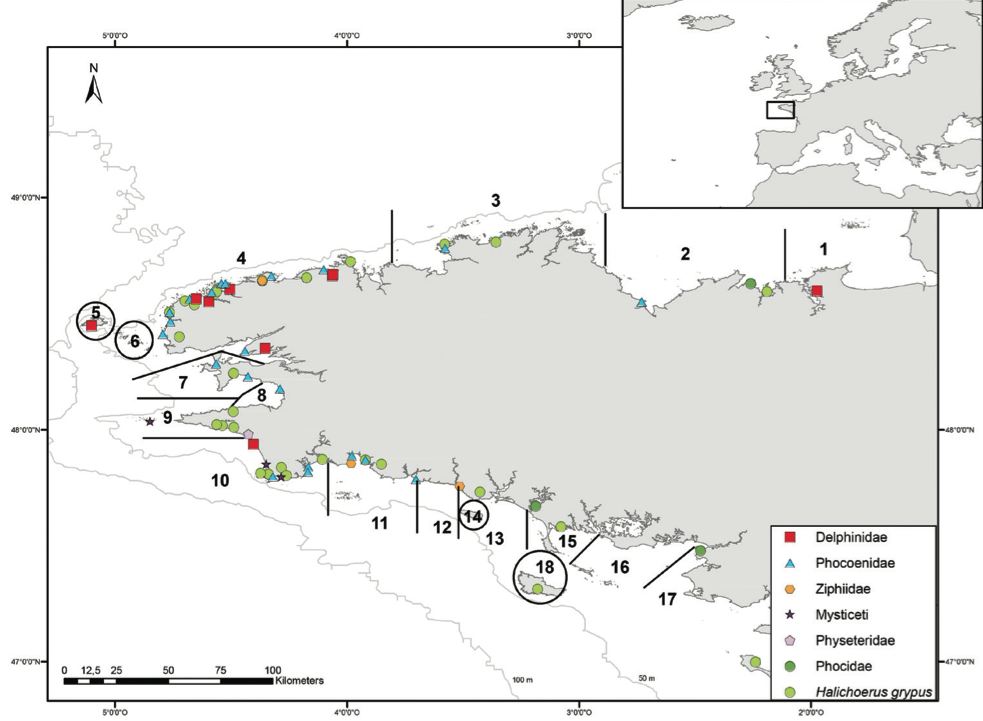
Locations of stranded marine mammals in Brittany, France (Alfonsi et al., 2013)

 Alfonsi et al. (2013) successfully analyzed DNA samples from 92 marine mammals. The data helped confirm that animals were being correctly identified based on morphology when morphological measurements were possible. The data also helped to identify rare species and identify specimens that were too degraded or incomplete to identify based on morphology alone. In addition, Alfonsi et al. (2013) proposed that DNA barcoding could be used to monitor population movements. By combining their findings with the ongoing database, Alfonsi et al. (2013) determined that the two most commonly stranded species were the short-beaked common dolphin (Delphinus delphis) and the gray seal (Halichoerus grypus).

Calich_RJD_Blog_DNAbarcoding_Fig2

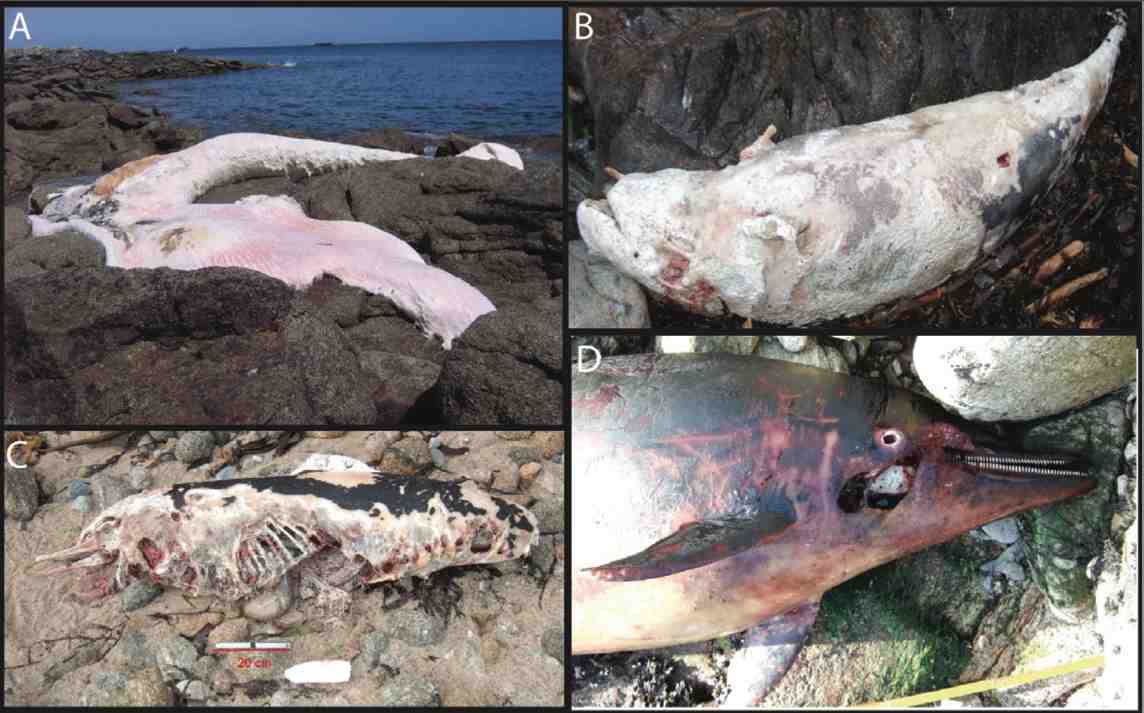
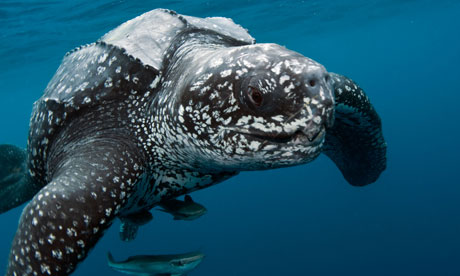
Examples of stranded marine mammals that were identified to the species level using DNA barcoding by Alfonsi et al. (2013). A-Fin Whale (Balaenoptera physalus), B-Risso’s Dolphin (Grampus griseus), C-Short-beaked common dolphin (Delphinus delphis), D-Striped dolphin (Stenella coeruleoalba)

This study was the first to demonstrate that DNA barcoding can be used to monitor marine mammal diversity through strandings data. Additionally, Alfonsi et al. (2013) showed that even when a carcass is severely degraded, good quality DNA samples can still be obtained. While more work is necessary to fine-tune identifying closely related species (e.g., within the Delphininae family), DNA barcoding has the potential to greatly increase the amount of usable data researchers can obtain from marine mammal strandings.


References:

Alfonsi E, Méheust E, Fuchs S, Carpentier F-G, Quillivic Y, Viricel A, Hassani S, Jung J-L (2013) The use of DNA barcoding to monitor the marine mammal biodiversity along the French Atlantic coast. In: Nagy ZT, Backeljau T, De Meyer M, Jordaens K (Eds) DNA barcoding: a practical tool for fundamental and applied biodiversity research. ZooKeys 365: 5–24. doi: 10.3897/zookeys.365.5873 Posterior probabilities for species identification determined by the nMDS analysis. doi: 10.3897/zookeys.365.5873.app2

CBOL (2014) What is DNA Barcoding? Received from: http://www.barcodeoflife.org/content/about/what-dna-barcoding


Phytoplankton: Small Organisms with a Massive Impact

by Heather Alberro, RJD Intern

Phytoplankton, microscopic marine photosynthetic organisms, have a vastly significant role to play not only in the marine food web of which they’re part of, but also on a more global scale. Despite their infinitely small size in comparison to other marine organisms, these tiny creatures occupy an immensely important ecological niche: they are the foundation of the marine food web, and as primary producers, play key roles in supporting all other organisms in the marine environment, as well as in the regulation of the Earth’s climate through the sequestration of carbon, oxygen production, and other related processes. Phytoplankton account for roughly half of all global primary productivity; therefore, their significance extends far beyond the marine environment alone. There is an intriguing sense of irony in the realization that these tiny living beings that often live out their existence unnoticed and undetected by the rest of the world, have such a far-reaching impact on the lives of virtually all other living organisms on the planet, particularly on those in the marine environment. The world that we have become accustomed to has been and is continuously shaped by the workings of these miniscule yet vital “plants of the sea”.

  Freshwater phytoplankton, mainly Diatoms and Dinoflagellates


Freshwater phytoplankton, mainly Diatoms and Dinoflagellates

The name “phytoplankton” can be divided into two meanings, “phyto” being the Greek word for “plant”, and “plankton” meaning “to wander or drift”; thus, phytoplankton are microscopic “drifting” plants that live in aquatic environments, and are not restricted to the oceans. However, phytoplankton are not merely one homogenous group of organisms, they represent a rich diversity of shapes, colors, and varieties, ranging from single-celled photosynthetic bacteria such as cyanobacteria, to plant-like diatoms and armor-plated cocolithophores[1]. As the aquatic counterparts to plants on land, the terrestrial primary producers, phytoplankton contain a green pigment known as chlorophyll, which captures sunlight and then, through the photosynthetic process, transforms it into chemical energy. Sunlight is crucial for phytoplankton productivity, as is the case for terrestrial plants. This photosynthetic ability is characteristic to all phytoplankton, and it is through this ability that they perform the crucial functions of absorbing carbon dioxide and releasing oxygen, processes that are essential for the continuation of life.

Coccolithophore – Single-celled marine phytoplankton

Coccolithophore – Single-celled marine phytoplankton

Cyanobacteria warrant a closer look, as they are by far the most ubiquitous and ancient group of phytoplankton on our planet, a point on which Paul Falkowski et al dwell in their article, Phytoplankton and Their Role in Primary, New, and Export Production. Cyanobacteria, also known as “blue-green algae” due to their color, are a class of prokaryotic[2] phytoplankton that evolved over 2.8 billion years ago, playing an essential role in shaping the Earth’s carbon, oxygen, and nitrogen cycles over sweeping expanses of time[3], and leading to the biogeochemical conditions of the present. In light of the vast numbers of cyanobacteria currently present in the biosphere, Falkowski et al note, “There are approximately ,10-24. cyanobacterial cells in the oceans”, a number that exceeds “all the stars in the sky”. These organisms are all-important and ever-present, yet remain virtually imperceptible to all other living beings.

The photosynthetic abilities of phytoplankton play a key role in the regulation of the Earth’s climate, largely through their impact on the carbon cycle. Just like terrestrial plants, phytoplankton, through the photosynthetic process, consume vast quantities of carbon dioxide. This carbon dioxide is stored within the phytoplankton. When phytoplankton are preyed upon by other organisms, some of the carbon makes its way back to near-surface waters, and some travels to the ocean depths. According to Rebecca Lindsey and Michon Scott’s article, What are Phytoplankton?, this ““biological carbon pump” transfers about 10 gigatonnes of carbon from the atmosphere to the deep ocean each year. Even small changes in the growth of phytoplankton may affect atmospheric carbon dioxide concentrations, which would feed back to global surface temperatures.” These miniscule beings, through a series of chemical processes, regulate key global activities in the biosphere such as the climate system, which affect all other living organisms in marine and terrestrial ecosystems alike.

Cyanobacteria under microscope

Cyanobacteria under microscope

In The Functioning of Marine Ecosystems, Philippe Curry et al shed light on the significance of phytoplankton in the overall functioning of the marine food web, and how phytoplankton exert a sort of “bottom-up” control on the food web’s various components. As primary producers who provide some of the basic elements essential to life, such as oxygen, phytoplankton essentially regulate food web dynamics, as they form the very basis of its existence. Phytoplankton, the “plants of the sea”, form the foundation of the marine food web, supporting successive trophic levels such as zooplankton[4], organisms that feed on zooplankton such as fish, and then predators that feed on the fish such as seals, sea lions, sharks, and marine mammals. Therefore, even organisms at the very top of the food web, including apex predators such as sharks and orcas, ultimately depend on the ecological base that is formed by phytoplankton. Declines in phytoplankton populations, apart from its effects on the Earth’s climate, can result in subsequent dwindling zooplankton populations, which in turn affect secondary and tertiary-level consumers such as fish and sharks.

Phytoplankton, as photosynthetic primary producers, not only form the ecological foundation of aquatic environments, but also serve as key drivers of the Earth’s carbon and oxygen cycles. These vital ecosystem functions are crucial to life on Earth for all living organisms. It is rather remarkable that such infinitesimal creatures have played, and continue to play, such principal roles in shaping the Earth’s biogeochemical composition. Phytoplankton are the source of crucial processes such as photosynthesis which provide the elements necessary for nearly all other organisms to survive. As Science Daily illustrates, “Phytoplankton is the fuel on which marine ecosystems run. A decline of phytoplankton affects everything up the food chain, including humans.” Even the largest being in existence, and to have ever existed, the blue whale, ultimately relies on a viable population of phytoplankton in order to sustain itself. The very small in many ways control and support the very large.

REFERENCES

Falkowski, Paul G., et al. “Phytoplankton and their role in primary, new, and export production.” Ocean biogeochemistry. Springer Berlin Heidelberg, 2003. 99-121.

Lindsey, Rebecca, M. Scott, and R. Simmon. “What are phytoplankton.” NASA’s Earth Observatory. Available on http://earthobservatory. nasa. gov/Librar y/phytoplankton (2010).

Cury, Philippe, Lynne Shannon, and Yunne-Jai Shin. “The functioning of marine ecosystems: a fisheries perspective.” Responsible fisheries in the marine ecosystem (2003): 103-123.

Dalhousie University. “Marine phytoplankton declining: Striking global changes at the base of the marine food web linked to rising ocean temperatures.” ScienceDaily, 28 Jul. 2010. Web. 31 Oct. 2013.


[1] What are Phytoplankton?, Rebecca Lindsey and Michon Scott

[2] Prokaryotes are organisms whose cells lack a membrane-bound nucleus.

[3] Phytoplankton and Their Role in Primary, New, and Export Production, Paul Falkowski et al

[4] Zooplankton are heterotrophic, or “animal” plankton.

Marine Protected Area Connectivity

by Hannah Armstrong, RJD Intern

More than 25% of the world’s fishery populations are considered overexploited or depleted, and 40% are heavily to fully exploited (Dayton PK, Sala E, Tegner MJ, Thrush S).  In fact, some marine organisms have been driven extinct by human activity, while others remain close to extinction (Dayton PK, Sala E, Tegner MJ, Thrush S).  In addition to other approaches, marine-protected-area design and implementation is an evolving tool to help conserve and manage these depleting fisheries.  They are not only important for biodiversity conservation, but also as management and learning tools (Pujola JM, Schiavina M, Di Franco A, Melia P, Guidetti P, Gatto M, De Leo GA, Zane L.).  Networks of marine protected areas, which differ in shape and size, help scientists evaluate theories of optimal shape and size for proper management and design, ultimately leading to adaptive management strategies (Pujola JM, Schiavina M, Di Franco A, Melia P, Guidetti P, Gatto M, De Leo GA, Zane L.).  The effectiveness of marine protected areas, as well as the importance of marine protected area connectivity, however, does not seem to be fully understood.

Protected areas are becoming ever more critical in marine habitats, especially with increasing threats of overfishing, pollution and coastal development.  When it comes to the design of marine protected areas and marine reserves, it is imperative that scientists and researchers consider patterns of connectivity.  Marine connectivity is the bridge between marine habitats, occurring via larval dispersal as well as by the movements of adults and juvenile marine species; it is an important part of ensuring larval exchange and the replenishment of biodiversity in areas damaged by natural or human-related agents (McLeod E, Salm R, Green A, Almany Jeanine).  Studies have shown that surface currents typically define dispersal patterns, but not all distribution is explained by passive drift alone; some migrations cause larvae to be transported in one direction by surface currents, and in another direction many hours later by subsurface currents (Dayton PK, Sala E, Tegner MJ, Thrush S).  It is critical to study the connectivity caused by different marine organism behaviors and transport processes to ensure optimal conservation.

According to the IUCN, a marine protected network is a “collection of individual MPAs operating cooperatively and synergistically, at various spatial scales, and with a range of protection levels, in order to fulfill ecological aims more effectively and comprehensively than individual sites could alone” (McLeod E, Salm R, Green A, Almany Jeanine).  The consideration of connectivity in marine protected area network design allows critical areas to be protected.  Critical areas include nursery grounds, fish spawning aggregation sites, regions that feature high species diversity or high rates of endemism (habitat-specific), and areas that contain a variety of habitat types in close proximity to one another (McLeod E, Salm R, Green A, Almany Jeanine).

In order to maintain ecosystem function, critical areas, such as fish spawning aggregation sites, need to be protected in marine protected areas. (source: McLeod E, Salm R, Green A, Almany Jeanine.  Designing marine protected area networks to address the impacts of climate change.  Frontiers in Ecology and the Environment 7 (2009).)

In order to maintain ecosystem function, critical areas, such as fish spawning aggregation sites, need to be protected in marine protected areas.
(source: McLeod E, Salm R, Green A, Almany Jeanine. Designing marine protected area networks to address the impacts of climate change. Frontiers in Ecology and the Environment 7 (2009).)

In recent scenarios in which climate change has become a notable issue, it is also essential to protect areas that may be naturally more resistant or resilient to the threats associated with climate change (ie: coral bleaching) (McLeod E, Salm R, Green A, Almany Jeanine).  Moreover, the potential for MPAs to change population sustainability, fishery yield, and ecosystem properties depends on the poorly understood consequences of three critical forms of connectivity over space: larval dispersal, juvenile and adult swimming, and movement of fishermen (Botsford LW, Brumbaugh DR, Grimes C, Kellner JB, Largier J, O’Farrell MR, Ralston S, Soulanille E, Wespestad V).  Without taking into account these factors, connectivity amongst marine protected areas or networks is not possible.

Overfishing has caused fisheries to be exploited or in some cases overexploited, making marine protected areas a much more critical tool in marine conservation. (source: wikimedia commons http://commons.wikimedia.org/wiki/File:Theragra_chalcogramma_fishing.jpg)

Overfishing has caused fisheries to be exploited or in some cases overexploited, making marine protected areas a much more critical tool in marine conservation.
(source: wikimedia commons http://commons.wikimedia.org/wiki/File:Theragra_chalcogramma_fishing.jpg)

Still, it is only once scientists and MPA implementers fully understand connectivity patterns that proper conservation techniques and MPA management can occur.  Some data shows that a variety of marine species indicate that larval movements of 50-100km appear common for marine invertebrates, and from 100-200km for fishes (McLeod E, Salm R, Green A, Almany Jeanine).  Some researchers believe that a system-wide approach should be adopted that addresses patterns of connectivity between ecosystems like mangroves, reefs, and sea grass beds to enhance resilience (McLeod E, Salm R, Green A, Almany Jeanine).  If there is connectivity between linked habitats, then ecosystems can continue to function properly, or in some cases, recover from their depleted states.  Those designing marine protected networks can use this data to determine the appropriate size of the reserve being implemented, allowing them to ensure larval connectivity.

Networks of marine reserves have become key tools in the effort to conserve our world’s oceans and the species therein.  Future selection of marine protected areas and networks will depend on both the connectivity of targeted species, as well as the habitat quality of individual sites (Berglund M, Jacobi MN, Jonsson PR).  Though there are opposing opinions regarding the most effective methods of marine biodiversity conservation, as well as with regard to the specific locations, sizes, and connectivity of marine reserves (Sala E, Aburto-Oropeza O, Paredes G, Parra I, Barrera JC, Dayton PK), there are growing research efforts to ensure successful conservation and management.

REFERENCES

1.Christie MR, Tissot BN, Albins MA, Beets JP, Jia Y, et al.  Larval Connectivity in an Effective Network of Marine Protected Areas.  Plos One 5 (12) (2010).

2. Botsford LW, Brumbaugh DR, Grimes C, Kellner JB, Largier J, O’Farrell MR, Ralston S, Soulanille E, Wespestad V.  Connectivity, sustainability, and yield: briding the gap between conventional fisheries management and marine protected areas. Reviews in Fish Biology and Fisheries 19 (1) (2009).

3. Planes S, Jones GP, Thorrold SR.  Larval dispersal connects fish populations in a network of marine protected areas.  PNAS 106 (14) (2009).

4. Sala E, Aburto-Oropeza O, Paredes G, Parra I, Barrera JC, Dayton PK.  A General Model for Designing Networks of Marine Reserves.  Science 298 (5600) (2002).

5. Berglund M, Jacobi MN, Jonsson PR.  Optimal selection of marine protected areas based on connectivity and habitat quality.  Ecological Modeling 240 (2012).

6. McLeod E, Salm R, Green A, Almany Jeanine.  Designing marine protected area networks to address the impacts of climate change.  Frontiers in Ecology and the Environment 7 (2009).

7. Pujola JM, Schiavina M, Di Franco A, Melia P, Guidetti P, Gatto M, De Leo GA, Zane L.  Understanding the effectiveness of marine protected areas using genetic connectivity patterns and Lagrangian simulations.  Diversity and Distributions, A Journal of Conservation Biology (2013).

8.  Dayton PK, Sala E, Tegner MJ, Thrush S.  Marine Reserves: Parks, Baselines and Fishery Enhancement.  Bulletin of Marine Science 66 (3) (2000).

Coral Reefs and the Threat of Ocean Acidification


by Hanover Matz, RJD Intern

While global climate change is often the environmental concern at the forefront of the discussion about greenhouse gas emissions, ocean acidification is a marine conservation issue just as closely tied to the amount of carbon dioxide (CO2) humans have put into the atmosphere since the Industrial Revolution. It is understood that the oceans act as a sink for atmospheric CO2: as humans increase the amount of carbon dioxide in the atmosphere by burning fossil fuels, more carbon dioxide diffuses from the atmosphere into the world’s oceans. This increase in the uptake of CO2 affects the ocean by reducing the pH, or increasing the acidity, of seawater, an effect known as ocean acidification (Kleypas et al. 2006). Chemically, ocean acidification occurs through the following process: an increase in the concentration of CO2 in the water leads to an increase in the concentration of two chemicals: bicarbonate (HCO3) and hydrogen ions (H+). By increasing the concentration of H+, the pH of the water is lowered and becomes more acidic. This shift in equilibrium towards bicarbonate and hydrogen ions also causes a shift in the chemistry of calcium (Ca2+) and carbonate (CO32-) ions. Hydrogen ions react with available carbonate ions to produce more bicarbonate, a process which reduces the formation of solid calcium carbonate (CaCO3). Thus ocean acidification has two significant chemical effects on the marine environment: it lowers the pH and decreases the availability of carbonate (Hoegh-Guldberg et al. 2007)  

The chemical reactions involved in ocean acidification (Hoegh-Guldberg et al. 2007)

The chemical reactions involved in ocean acidification (Hoegh-Guldberg et al. 2007)

What does this mean for coral reefs? The hard coral species that make up reefs today belong to the order Scleractinia. These scleractinian corals are a colony of polyps that form a hard exoskeleton by secreting aragonite, a solid form of calcium carbonate. Increasing ocean acidification reduces the availability of carbonate in the water as well as the pH, so it is more difficult for the corals to form necessary hard skeletons. Many cellular and physiological responses have been observed in corals subjected to increased acidification, as shown in a 2012 study by Kaniewska et al. on Acropora millepora. The corals in the study were subjected to increasing levels of CO2, and were shown to exhibit changes in metabolism, calcification, and cellular activity. Not only do high levels of CO2 make it more difficult for corals to calcify, or form hard skeletons, due to the lack of carbonate, but they make the energy investment in calcification for the coral more costly. Corals rely on endosymbiotic algae in their cells known as Symbiodinium, or zooxanthellae, for energy from photosynthesis. Kaniewska et al. showed that increasing the level of CO2 caused the coral branches to lose their symbiotic algae, a process normally caused by increasing ocean temperature known as bleaching. Those corals that retained their zooxanthellae exhibited a 60% reduction in net photosynthesis per cell. A reduction in photosynthesis means less available energy to coral polyps, which in turn reduces coral health and reproductive ability. The study also indicated an increase in internal cellular pH regulation by the corals due to changes in CO2 levels. Increasing internal pH regulation may result in less energy being devoted to calcification. By decreasing calcification, not only does ocean acidification decrease coral growth, but it also decreases the accretion of the reef system as a whole.

Why do these physiological effects on corals matter to the reef ecosystem, or to human society? Corals constitute the primary three dimensional structures of most reef systems; any negative effect to their health will detrimentally affect the health of the reef. A study by Hoegh-Guldberg et al. published in 2007 demonstrated the effect increasing ocean acidification will have on coral reef ecosystems. The use of field studies and experimental simulations produced a model that showed as global ocean temperatures rise and pH levels fall due to increasing atmospheric CO2, it is expected that coral dominated communities will be replaced by macroalgae and non-coral dominated communities. The basic cause behind this is decreased coral calcification: if it becomes harder for the corals to produce their calcium carbonate skeletons, their structures will become weaker, their growth decreases, they may be eroded or damaged, and they will be outcompeted by other species, specifically macroalgae. The stress induced by ocean acidification may also cause reduced coral reproduction, yet another factor leading to decreased coral dominated reefs. Without corals, the biodiversity of a reef system greatly decreases as there is no longer a viable habitat for many fish species. For humans, this means significant potential damage to both fishing and tourism industries that rely on coral reefs and the fish they support. Without tourism and fishing, many countries would not only lose a significant source of income, but a significant food source for their growing populations. Coral reefs also provide protection from wave action and storms, reducing coastal erosion. The study indicates that the model takes into account atmospheric CO2 increases at the lower end of predictions for the coming century. The authors astutely note that it is “sobering” to realize these serious effects on coral reefs are based on the most optimistic outcomes of atmospheric CO2 and global temperature changes.

Potential dominant reef communities at predicted levels of atmospheric CO2 and ocean temperature increases (Hoegh-Guldberg et al. 2007)

Potential dominant reef communities at predicted levels of atmospheric CO2 and ocean temperature increases (Hoegh-Guldberg et al. 2007)

Is there any hope for coral reefs? Is it at all possible that they can adapt to the threat of ocean acidification? One study does indicate that some corals may have the ability to adjust to decreasing ocean pH. McCulloch et al. published a study in 2012 that focused on the ability of corals to up-regulate their internal pH levels. Corals precipitate new calcium carbonate in a fluid between the existing skeleton and part of the polyp known as the calicoblastic ectoderm. At this calicoblastic layer, corals are capable of increasing the pH relative to the pH of ambient seawater in order to facilitate calcification. The study results indicate that for some coral species, as the ambient seawater pH decreases due to acidification, the corals are capable of further up-regulating their internal pH in response in order to reduce the overall internal change in pH and to continue to calcify. This up-regulation of internal pH results in higher coral calcification rates compared to abiotic or chemical precipitation of calcium carbonate at the same seawater pH. The coral species demonstrate an ability to adjust their internal pH in order to continue calcifying in acidic conditions. Does this mean these coral species will be better able to survive increasing ocean acidification? Perhaps, but the study indicates that it is necessary for the corals to maintain their symbiotic relationship with zooxanthellae in order to produce the energy needed for calcification. The loss of zooxanthellae to stress or bleaching events would reduce the effectiveness of this ability. While some corals may exhibit less sensitivity to pH changes than others based on their ability to up-regulate internal pH, all coral species will likely have difficulty adapting to not only ocean acidification, but the combined effects of ocean acidification, changes in ocean temperature, and the impact of human pollution.

Seawater pH versus internal pH of calcifying fluid of coral species. Foraminifera (forams), another type of calcifying marine organism, do not exhibit this ability to up-regulate internal pH (McCulloch et al. 2012)

Seawater pH versus internal pH of calcifying fluid of coral species. Foraminifera (forams), another type of calcifying marine organism, do not exhibit this ability to up-regulate internal pH (McCulloch et al. 2012)

Ocean acidification is a significant threat to the health of coral reef systems. What can be done to prevent potential damage from acidification? In the face of this danger to reef ecosystems, there are possible conservation methods that can be taken to protect coral species. Coral reefs that are already in a healthy state are better prepared to handle changes in pH than those suffering from other environmental stressors. Reefs with stable levels of herbivorous grazers, such parrotfish or the sea urchin Diadema antillarum, are also more resilient to stress due to reduced competition with algae (Hoegh-Guldberg et al. 2007). Effective conservation management of coral reefs provides the best method for ensuring their survival. Continuing research to determine how to mitigate the effects of acidification is also necessary. As coral reefs are threatened by climate change, pollution, and other human induced stressors, ocean acidification will remain one serious part of the ongoing endeavor to protect coral reefs.

REFERENCES

  1. Hoegh-Guldberg, Ove, et al. “Coral reefs under rapid climate change and ocean acidification.” Science 318.5857 (2007): 1737-1742.
  2. Kaniewska, Paulina, et al. “Major cellular and physiological impacts of ocean acidification on a reef building coral.” PLOS ONE 7.4 (2012): e34659.
  3. Kleypas, J.A., R.A. Feely, V.J. Fabry, C. Langdon, C.L. Sabine, and L.L. Robbins, 2006. Impacts of Ocean Acidification on Coral Reefs and Other Marine Calcifiers: A Guide for Future Research, report of a workshop held 18–20 April 2005, St. Petersburg, FL, sponsored by NSF, NOAA, and the U.S. Geological Survey, 88 pp.
  4. McCulloch, Malcolm, et al. “Coral resilience to ocean acidification and global warming through pH up-regulation.” Nature Climate Change 2.8 (2012): 623-627.

Mating ground for North Atlantic right whales discovered in the Gulf of Maine

by Hannah Calich, RJD Graduate Student and Intern

North Atlantic right whales (Eubalaena glacialis) are among the most endangered species of marine mammals in the world. Their Endangered status is largely due to the fact that they were heavily targeted by the whaling industry for over 300 years. During that time it is estimated that somewhere between 5,500 and 11,000 North Atlantic right whales were removed (Reilly et al., 2012). Currently, there are approximately 500 individuals left in the world (Pettis, 2012).

Despite the fact that these animals have been classified as Endangered since 1984 they are not recovering well (Reilly et al., 2012). Both biological and anthropogenic factors are influencing the North Atlantic right whale’s recovery. The primary biological factors hindering recovery are a lack of reproductively capable females, a slow growth rate, and low genetic diversity in the population. The primary anthropogenic factors include vessel strikes and entanglement in fishing gear. Efforts to mitigate the anthropogenic factors include moving shipping lanes out of migration routes and modifying gear to reduce entanglement.

Despite the fact that there has been intensive research on the North Atlantic right whale for over 30 years their mating grounds have remained a mystery, until recently. Timothy Cole et al. (2013) used observations from aerial surveys to monitor the distribution of North Atlantic right whales and help determine their mating grounds. Surveys were conducted along the eastern coast of the US and Canada between 2002 and 2008. When whales were sighted each whale was photographed to aid in identification. North Atlantic right whales are unique from other whale species in that each whale has a distinct pattern of callosities on its head that helps researchers identify individual animals (Figure 1).

Figure 1 – The left side of a North Atlantic right whale’s head. This whale was sighted in the Bay of Fundy, Canada during August 2010. This animal was identified as a North Atlantic right whale based on its exaggerated lower jaw and the brown/grey callosities on top of its head. Photo by: Hannah Calich

Figure 1 – The left side of a North Atlantic right whale’s head. This whale was sighted in the Bay of Fundy, Canada during August 2010. This animal was identified as a North Atlantic right whale based on its exaggerated lower jaw and the brown/grey callosities on top of its head. Photo by: Hannah Calich

The North Atlantic Right Whale Catalog is used to identify individual whales. The catalog consists of over 200,000 photographs and has been ongoing since 1935 (New England Aquarium, 2013). Each record indicates when and where a whale was last sighted, who saw it, and any additional information (e.g., the sex of the whale). Cole et al. (2013) identified fertile females based on their close association with a calf (Knowlton et al., 1994) and fertile males based on previous genetic analyses and paternity testing.

To determine the most likely location for mating Cole et al. (2013) examined where fertile males and females congregated during the mating season. Since the exact mating season for North Atlantic right whales has not been determined researchers made inferences based on observations of a close relative, the southern right whale (Eubalaena australis; Best, 1994). Additional cues about when North Atlantic right whales mate included observations of when and where their newborn calves are found, the predicted gestation period of the mother, and observations of courtship behaviors. When these observations were combined Cole et al. (2013) hypothesized that the mating season for the North Atlantic right whale falls between November and February.

Between November and February fertile male and female North Atlantic right whales form large aggregations in the central Gulf of Maine; suggesting that this is likely a mating ground for the species (Figure 2). In addition to finding a potential mating ground researchers also determined that the fertile females observed in this aggregation came from two separate subpopulations. This observation supports the idea that the entire North Atlantic right whale population may come to the central Gulf of Maine to mate.

Figure 2 – Regions seasonally occupied by the North Atlantic right whale (Cole et al., 2013).

Figure 2 – Regions seasonally occupied by the North Atlantic right whale (Cole et al., 2013).

Cole et al. (2013) also recorded high numbers of fertile individuals in Roseway Basin. However, the Roseway Basin aggregation occurred 1-2 months before the central Gulf of Maine aggregation. Since the mating period for North Atlantic right whales has not been confirmed it is possible that in comparison to southern right whales, North Atlantic right whales may have a longer gestation period. If that is the case, Roseway Basin may also be a mating ground for the North Atlantic right whale.

Food availability may be one of the most important factors in determining where mating will occur (Cole et al., 2013). Social factors such as feeding area preference may also play an important role. If food availability helps determine mating grounds, the mating location may change in response to changing food conditions. A longer time series of data is required to determine if the mating grounds change in response to changing prey availability.

The recovery of North Atlantic right whales largely depends on successful reproduction. Unfortunately, the current reproduction rate is very low. By working to determine when North Atlantic right whales mate and why they decide to mate where they do, researchers are taking important steps toward protecting this Endangered from Extinction.

REFERENCES

Best, P.B. (1994) Seasonality of reproduction and the length of gestation in southern right whales, Eubalaena australis. J Zool (Lond) 232:175−189

Cole, T.V.N., Hamilton, P., Henry, A.G., Duley, P., Pace III, R.M., White, B.N., Frasier, T. (2013) Evidence of a North Atlantic right whale Eubalaena glacialis mating ground.  Endang Species Res 21:55−64

Knowlton, A.R., Kraus, S.D., Kenney, R.D. (1994) Reproduction in North Atlantic right whales (Eubalaena glacialis). Can J Zool 72:1297−1305

New England Aquarium (2013) North Atlantic Right Whale Catalog. http://rwcatalog.neaq.org/Terms.aspx (accessed October 2013)

Pettis, H. (2012) North Atlantic Right Whale Consortium 2012 annual report card. Report to the North Atlantic Right Whale Consortium, November 2012. www.narwc.org/ pdf/2012_Report_Card.pdf (accessed October 2013)

Reilly, S.B., Bannister, J.L., Best, P.B., Brown, M., Brownell Jr., R.L., Butterworth, D.S., Clapham, P.J., Cooke, J., Donovan, G., Urbán, J. & Zerbini, A.N. (2012) Eubalaena glacialis. In: IUCN 2013. IUCN Red List of Threatened Species. Version 2013.1. www.iucnredlist.org (accessed October 2013)

Fishery Benefits From Behavioral Modification of Fishes in Periodically Harvested Fisheries Closures

by Pat Goebel, RJD Intern

In the South Pacific, periodically harvested fisheries closures are often implemented as a conservation and fisheries management tool. This is an important management tool because it allows resource users a greater say in the development and enforcement of rules, which in turn will lead to a successful fisheries management. Periodically harvested fisheries closures are areas of fishing grounds where fishing is normally prohibited, but is occasionally permitted for a short period. This is not to be confused with periodic closures, where areas of fishing grounds are normally open and occasionally closed. Previous studies have shown that periodically harvested closures can sustain higher fish biomass and larger individuals, particularly of targeted species. However, there is a lack of knowledge on whether periodically harvested closures can provide both social and ecological benefits.

A recent study conducted by Januchowski-Hartley and colleagues investigated the role of fish behavior, the effects of periodic harvest on fishery targeted families and total fish biomass in the Ngunao-Pele Marine Protected Area Network, North Efate, Vanuatu (Figure 1). A before-after-control-impact pair design, was used to quantify flight initiation distance (FID), and biomass of two fishery-target (Acanthuridae and Scaridae) and one non-target (Chaetodontidae) families in two periodically harvested closures, two no-take marine reserves, and two open fished areas, prior to and after harvest of the periodically harvested closures. Creel surveys were used to quantify catch per unit effort in open fishing grounds and during the periodic harvest.

Figure 1 from Januchowski-Hartley et al. 2013

Figure 1 from Januchowski-Hartley et al. 2013

Before harvest, FID of targeted families was higher in fished areas than periodically areas (Figure 2). Total Biomass was lower in fished areas than in no-take reserves and periodically harvested closures. As a result of lower FID and higher biomass, CPUE increased for fishing trips inside the periodically harvested closures than regular fishing activities. Also, fishes were generally larger in catches from periodically harvested closures.

Acanthuridae FID differed significantly between and pre- and post-harvest, while Scaridae did not differ pre- to post harvest. However, Scaridae FID in no-take reserves was significantly lower than in periodically harvested closures, which in turn was significantly lower than in fished areas (Figure 2).

Acanthuridae were significantly more abundant in the harvest than Scaridae. Before, harvest Acanthuridae had a mean FID below the maximum effective range of spear guns, while Scaridae had a mean FID at the maximum effective range of spear guns. Spear fisherman will target fish with a higher catachability or lower FID. This finding is an important tool for fisheries management as some fishery-target families are more susceptible to harvesting than other based on behavioral changes.

Figure 2 from Januchowski-Hartley et al. 2013

Figure 2 from Januchowski-Hartley et al. 2013

This study provides evidence that lightly harvested periodically harvested closures are an alternative tool that can maintain similar levels of biomass to marine protected areas, while increasing fishing efficiency when opened for harvesting. This increase in efficiency appears to arise primarily through changes in the behavior of fishery target reef fish. Before harvest, mean FID of Acanthuridae and Scaridae were lower in the periodically harvested closures than fished areas, while CPUE during harvest of the closures was almost double that of normal fishing activities. When fishes are protected temporarily from fishing, their cautiousness declines, which makes them more susceptible of being harvest when fishing is reinstated. Periodically harvest fisheries closures can maintain biomass and provide many of the benefits that are expected from permanent no-take areas. However, more research is needed to understand the sustainable limits of periodic harvested closures. In this study a low-intensity harvesting strategy was used and did not lead to a decline in biomass. A longer duration or more intense harvesting could possible lead to a decrease in biomass.

REFERENCE

Januchowski-Harlety F. A., Cinner J. E., Graham A.J. (2013) Fishery Benefits From Behavioral Modification of Fishes in Periodically Harvested Fisheries Closures. Aquatic Conservation: Marine and Freshwater Ecosystems.  DOI: 10.1002/aqc2388

Eighty Sea Turtles Wash up Dead on the Coast of Guatemala

by Michelle Martinek, RJD Intern

The volcanic black sand beaches of Guatemala’s southeastern coast are usually a vision of natural beauty for residents and visitors, but lately they have been witness to a tragic event- the mass stranding of sea turtles. According to a statement released by the wildlife rescue and conservation association, ARCAS, eighty dead sea turtles have been recorded on the shores of La Barrona, Las Lisas, Chapeton, and Hawaii since the first week of July. Environmentalists suspect there may be a connection between nearby shrimping boats and the recent sea turtle strandings. Agriculture Ministry officials in Guatemala say the cause of the deaths will be investigated.

The majority of the dead animals were olive ridley sea turtles (Lepidochelys olivacea), Pacific green sea turtles (Chelonia mydas) and leatherbacks (Dermochelys coriacea). Olive ridley sea turtles are currently listed as Vulnerable by the IUCN and leatherback sea turtles are Critically Endangered. The entire coast of Guatemala, which borders the Pacific Ocean, has historically been an important nesting area for both olive ridley and leatherback sea turtles. Although not known to nest in Guatemala, east pacific green turtles forage in estuaries and mangrove waterways along the Pacific coast (Lutz and Musick).

A male leatherback sea turtle. Photo: Michael Patrick O'Neill/Alamy

A male leatherback sea turtle. Photo: Michael Patrick O’Neill/Alamy

Located between Mexico and El Salvador, the 250 miles of coastline in Guatemala is a small expanse of ideal habitat. It has rivers, mangroves, wetlands, lagoons, beaches, and attracts many sea turtles for feeding and nesting purposes. Residents are troubled by the recent deaths because the sea turtles are a valuable resource. Not only do they draw many tourists, but despite the endangered status of the turtles, their eggs are a source of food and income for locals. The success of sea turtle conservation in the area relies on 24 hatcheries, managed as part of a legal egg harvest. ARCAS is a non-profit NGO founded in 1989 which, among many other things, manages two of the 24 sea turtle hatcheries on the Pacific coast of Guatemala. Villagers are allowed to collect eggs laid on the beaches provided that 20 percent of each clutch is donated to a hatchery. This system was initiated in 1980 in an effort to conserve sea turtle populations. However, many of the hatcheries are underfunded and operating with limited scientific training. Short-staffing means that beach monitoring and research activities are rare events, making it hard to collect accurate data on the sea turtle strandings and status of the nestings.

The numerous dead sea turtles washing up on the beaches is suspected to be the result of the nearly unregulated shrimp harvesting industry operating in the nearby waters. Since sea turtles have lungs and must surface for air, they will drown if caught in the fine mesh nets used by shrimp boats. Although Guatemalan trawlers are required to use turtle excluder devices (TEDs), enforcement is difficult and fines are light.

Loggerhead sea turtle escapes from a trawl net fitted with a turtle excluder device. Photo: NOAA

Loggerhead sea turtle escapes from a trawl net fitted with a turtle excluder device. Photo: NOAA

In an interview for mongabay.com, Colum Muccio, ARCAS administrative director said, “I don’t think it’s a coincidence that when shrimp trawlers appear in the ocean that we begin having stranded turtles.”  ARCAS, along with other conservationists and researchers, are petitioning the government for action to combat the killing of the sea turtles. The lack of regulation in the egg harvesting and shrimping industry has the potential to severely hurt populations. The large number of sea turtle mortalities in the past six months can be used as an eye opener to the conservation community and world at large; something will need to change in order to save the lives of these already endangered animals.

REFERENCES

Avery, Lacey. “Eighty sea turtles wash up dead on the coast of Guatemala.” Guardian Environment Network 28 Aug 2013, Web. 1 Nov. 2013.

Lutz, Peter L., and John A. Musick. The Biology of Sea Turtles. CRC Press, 1997. 143-145. eBook.

http://www.arcasguatemala.com/

Sea Otters: Their Role in Controlling the Abundance of Other Organisms

by Jessica Wingar, RJD Intern

Sea otters, Enhydra lutris, are very playful and charismatic marine organisms. They can often be seen swimming on their backs, just floating in the ocean. In addition to the fact that they are extremely charming creature, they have very many distinct qualities that not many other marine animals possess. Sea otters can often be seen using tools. By this, it is meant that they use rocks and whatever other objects that they can find in the ocean. They use these tools to crack open the shells of crustaceans, which happen to be one of their main sources of food (“Sea Otter”). Not only are sea otters important because of their unique tool use, but they also play a critical role in the food chain of the ecosystem that they live in.

A Sea Otter floating on its back in seagrass.

A Sea Otter floating on its back in seagrass.

Every ecosystem on the entire planet, has a system of what organism eats what and how these organisms affect each other. This cascade of organisms is often referred to as a trophic pyramid. In this pyramid there are different levels. Starting at the bottom, the levels go from the primary producers to the primary consumers to as many consumers as the system has, and then finally to the top consumers, which are the predators (Garrison, 2010). There are many ways in which these systems are controlled. Tropic cascades that are controlled top down are systems in which the consumers control the abundance or the lower levels, and systems that are controlled bottom up are systems in which the amount of consumers is limited by the availability of resources that are at the lower levels (Richardson, 2013). With increasing anthropogenic affects on ecosystems, what controls top up and bottom down is rapidly changing.

Sea otters and their interaction with other organisms in their environment, are often used as a classical example of a trophic cascade. As mentioned previously, sea otters like to feed on crabs. These crabs like to feed on seagrass in their marine community. Thus, sea otters control the abundance of crabs and crabs control the abundance of seagrass in their oceanic ecosystem. However, human affects have altered some top down and bottom up controls on this community. Some of the top down anthropogenic affects include hunting of the top predators. An example of this would be killing sea otters for their fur. Some bottom up controls include increasing the amount of nutrients in the water. The increase of nutrients comes from run off from the land. The question is, does the increase in sea otters, still cause the crab community to decrease and the seagrass community to increase?

It is critical to know what is happening with the seagrass community because of the number of sea otters in the ecosystem because seagrass has a very important ecological role. Seagrass serves as food for crabs, it controls secondary production, and it can also serve as a nursery habitat for many organisms. Since, sea otter decline has been happening for many years, when a sea otter community began to increase in numbers and nutrient run off increased in this area, it provided scientists with a perfect opportunity to study this trophic cascade.

The trophic cascade of the sea otter ecosystem.

The trophic cascade of the sea otter ecosystem.

There was a study conducted in Elkhorn Slough in California. One of the most staggering facts from this survey was that when sea otters recolonized the area in 1984, the eelgrass population increased by 600%, which definitely displays that sea otters have something to do with the population of seagrass. According to the trophic cascade, an increase in sea otters would lead to a decrease in the crab population. It was discovered that the crab population did decrease. It was concluded that sea otters were one of the main causes of this decrease because during this time, other predators in the ocean, such as sharks, were in decline due to overfishing. In addition, during this time crab harvesting had gradually decreased in this area because it became a Marine Protected Area in 2007. In addition to studying history and the current populations of sea otters, crabs, and eelgrass, these researchers did a computer model of the area, and they found the same results. Sea otters are controlling the amount of crabs and seagrass present in their communities, and are crucial to the well running of their habitats (Hughes et al, 2013).

REFERENCES

Garrison, T. (2009). Oceanography:an invitation to marine science. (7th ed.).

Hughes, B.B., Eby, R, Van Dyke, E, Tinker, T, Marks, C.I., Johnson, K.S., and Kerstin Wasson. “Recovery of a top predator mediates negative eutrophic effects on seagrass.” PNAS. 110.38 (2013): 15313-15318.

Sea otters. (2013). Retrieved from http://animals.nationalgeographic.com/animals/mammals/sea-otter/

Richardson, Jill. “Feeding Ecology and Behavior.” MSC 350. University of Miami, Coral Gables. Mar. 2013. Lecture.

13 things RJD did in 2013

2013 was a great year for the University of Miami’s RJ Dunlap Marine Conservation Program, and we wanted to share some of the highlights with you!

1

1) We caught, measured, sampled and tagged 318 sharks, including 34 bull sharks, 23 lemon sharks,54 blacktip sharks, 35 tiger sharks, 20 great hammerheads, and even a great white! This included a successful expedition to tiger beach in the Bahamas. 19 tiger sharks, 3 scalloped hammerhead sharks, 7 great hammerheads, 8 bull sharks, and 1 blacktip shark were satellite tagged.

Great white shark in the Florida Keys.

Great white shark in the Florida Keys.

2) We took 1,584 people, of which well over 1,000 were high school students, out on the boat with us to learn about sharks and other marine science and conservation issues!

Students from MAST academy, one of our long time partners

Students from MAST academy, one of our long time partners

3) We published a paper about illegal shark fishing in the Galapagos.

4) We shared hundreds of marine science and conservation news stories on the RJD Facebook page, which now has over 3,000 fans! You should “like” us!

5) We published a paper about great white sharks scavenging on whales! You can see the video abstract here.

6) Using the RJ Dunlap twitter account (you should follow us), we held a twitter TeachIn about marine protected areas! This innovative teaching technique was profiled in Nature!

7) We published a paper about tiger shark feeding ecology and physiology! 

8 ) We co-hosted ScienceOnline Oceans, a conference focusing on how marine scientists can use internet tools for education and collaboration! Several RJD staff, including two undergraduate interns, moderated sessions!

9) We published a paper showing how social media can help scientists to write papers!

10) RJD students and staff spoke about sharks in over a dozen local schools, as well as to schools all over the country via Skype. We spoke with over 500 students around the country, from 1st grade through college!

RJD student David (in the back, wearing the awesome shark shirt) and Ms. Roche's 5th grade class at Vineyards Elementary (Naples, FL) love sharks!

RJD student David (in the back, wearing the awesome shark shirt) and Ms. Roche’s 5th grade class at Vineyards Elementary (Naples, FL) love sharks!

11) We published a paper showing how social media can benefit conservation scientists!

12) We welcomed the largest new group of interns in RJD history!

Lab photo

13) RJD students and staff presented at several scientific conferences, including Benthic Ecology, the American Elasmobranch Society, the International Congress for Conservation Biology, and ScienceOnline Together!

Bonus: We partnered with Good World Games and the Guy Harvey Ocean Foundation to make Musingo, a music trivia app that helps the oceans!

2013 was a great year for the RJ Dunlap Marine Conservation Program, and we’re looking forward to an even better year in 2014! Thanks to all of our research collaborators, partners and donors! Thanks for reading, and Happy New Year!


The RJ Dunlap Marine Conservation Program (RJD) is a joint initiative of the University of Miami’s Rosenstiel School of Marine & Atmospheric Science and Abess Center for Ecosystem Science and Policy. The mission of RJD is to advance ocean conservation and scientific literacy by conducting cutting edge scientific research and providing innovative and meaningful outreach opportunities for students through exhilarating hands-on research and virtual learning experiences in marine biology.

The Good, The Bad and The Ugly: A comparison between Whaling and Whale Watching

by Pat Goebel, RJD Intern

The profitability of a live whale compared to a dead whale has greatly increased over the last decade. Since the banning of commercial whaling, whale watching tourism has become a $2.1 billion dollar industry (Kuo 2011). As of 2008, 13 million people participated in whale watching in 119 countries, ranging from Norway to South Africa to Tonga, generating an expenditure of $2.1 billion (O’ Connor et al 2009). The value of a live whale substantially outweighs the production of a dead whale. Despite the significant difference, there are several countries that still participate in whaling.

Growth of whale watching from 1981 to 2008 (O’Conner et al 2009)

Growth of whale watching from 1981 to 2008 (O’Conner et al 2009)

A whaling moratorium was passed in 1986 as a means to protect and establish a sustainable whale fishery. However, Japan, Norway and Iceland all actively hunt whales either for “scientific research” or legalized whaling. In Japan, the whaling program/industry is worth $31.1 million. At the same time whale watching in Japan is estimated to be at $33.0 million (Parson 2013). However, in Norway, whale watching is estimated to be worth more than double the whaling industry. Therefore, it is evident that countries such as Norway have not realized the profitability of the whale watching industry.

Whaling is not only less profitable but may negatively affect the whale watching industry. Whaling reduces the number of whales available for watching, may disturb or alter the regular activities of whales, leads to negative attitudes of whale watchers or potential tourists toward whaling, and decreases the satisfaction for whale watchers (Kuo 2011, Hoyt and Hvenegaard 2002). Several surveys have shown that whale watching tourists actively avoid countries that hunt whales. For example, one survey of whale watchers in the United Kingdom found 79% of whale watching tourists would boycott visiting a country that conducted hunts for cetaceans (Parson 2013). The Japanese whale watching industry would most likely increase with the demise of whaling. An increase in whale watching tourism will not only help conserve whales but will also increase the overall income of Japan. Tourism distributes money horizontally throughout the area because tourists spend money on items such as hotels, food, cars, and site seeing.

Minke whale and calf dragged aboard Japanese whaling vessel

Minke whale and calf dragged aboard Japanese whaling vessel

Whale watching is clearly a more desirable and profitable use of whales than harvesting. However, there are some negative impacts. Whale watching can have direct and indirect effects on whales. The biggest direct threat is collisions between whales and whale watching vessels. This problem is growing due to the increase in traffic and faster boats. The industry continues to grow and more boats are entering the water now more than ever. There are reports dating to as early as the 1800s of ships hitting and killing whales. Noise pollution from whale watching boats is another problem. In an area with a lot of background noise, killer whales have been found to modify the frequency of their echolocation clicks, so their clicks are not obscured or masked by the noise of the environment. While such frequency changes may allow clicks to better stand out from background noise, it also changes the range or resolution of the clicks (Parson 2013). Either way may reduce the efficiency with which a killer whale can find food or acoustically see in the marine environment. Therefore, whales may change surfacing time, swimming behavior, direction, group size, and coordination as well (Parson 2013).  All of the changes may cause the animals to increase their energy expenditure. In whale watching hot spots, whales can be followed in great numbers for great durations. For example, the southern resident killer whale population is followed on average by 20 vessels for approximately 12 hours per day from May to September (Lachmuth et al 2011). You can think of the whales as celebrities and the boats as TMZ/ paparazzi. Celebrities are constantly in the spotlight being followed and nagged. In some cases they will change their route or time of day they depart their house in order to avoid the paparazzi. Also, some celebrities handle the lime-light/stress better than others and I would predict this is true of whale species. Lets just hope none of them go off the deep end like Miley Cyrus.

Whale watching tour in Bar Harbor, Maine

Whale watching tour in Bar Harbor, Maine

There has been a lack of regulations in whale watching industry. The implementation of rules has not kept up with the rapid growth. Recently, rules and regulations have been put in place in some countries as a way to protect the whales and ensure safe boating. However, the effort to enforce the regulations is lacking and many operators are not following them correctly. For example, a study conducted in Australia found that operators complied with only one of four guidelines (Parson 2013). I believe installing refuges or protected areas would be a very efficient way of protecting whales. These refuges allow animals to feed, hunt and rest without any anthropogenic disturbance.

There are clear differences between the whaling industry and the whale-watching industry. Both industries can impact the environment and whales negatively, but only the whaling watching industry can have a positive effect as well. The implementation of rules and regulations will have a significant effect on reducing the negative impacts of whale watching. The direct killing and slaughtering of whales will never provide an economic value as substantial as whale watching.

REFERENCES

Kuo, Hsiao-I., Chi-Chung Chen, and Michael McAleer. Estimating the impact of whaling on global whale-watching. Tourism Management 33, no. 6 (2012): 1321-1328.

PARSONS, E.C.M. An Introduction to Marine Mammal Biology and Conservation. Burlington, MA. Jones and Bartlett Learning, LLC. (2013)

O’Connor, Simon, R. Campbell, H. Cortez, and T. Knowles. Whale Watching Worldwide: Tourism numbers, expenditures and economic benefits. (2009).Hoyt, Erich, and Glen T. Hvenegaard. A review of whale-watching and whaling with applications for the Caribbean. Coastal Management 30, no. 4 (2002): 381-399.

Lachmuth, Cara L., Lance G. Barrett-Lennard, D. Q. Steyn, and William K. Milsom. Estimation of southern resident killer whale exposure to exhaust emissions from whale-watching vessels and potential adverse health effects and toxicity thresholds. Marine pollution bulletin 62, no. 4 (2011): 792-805.

Hoyt, Erich, and Glen T. Hvenegaard. A review of whale-watching and whaling with applications for the Caribbean. Coastal Management 30, no. 4 (2002): 381-399.