To eat or be eaten
By Arina Favilla, SRC intern
When we are hungry, all we have to do is open up the fridge and decide what we want to eat. On the other hand, when fish are hungry, they must leave the safety of their home to forage in areas where there are likely predators awaiting them. They must balance their decision based on hunger and risk factors: is this next meal worth the possibility of becoming prey?
All organisms must eat to meet certain metabolic and energetic demands to survive. The metabolic rate of a fish is influenced by temperature because most fish are ectothermic, meaning their body temperature depends on the surrounding water temperature. As water temperature increases, their metabolic rate increases, which consequently increases how often they forage to meet their energetic requirements. However, foraging also means putting themselves at risk for predation. To investigate how temperature and the impact of predation risk affects foraging activity, Pink & Abrahams (2015) set up controlled experiments with fathead minnows and a likely predator, yellow perch.
Methods
First, they observed foraging and activity rates of minnows exposed to different temperatures in aquarium tanks (39ºF, 59ºF, 75ºF). After food was dispersed by a feeder at the water’s surface, they recorded the number of times the fish would swim to the surface to eat as well as their activity level both before and after feeding for 30 min. They then added the risk of predation to assess how temperature impacts the level of risk fish are willing to take in order to eat. For 15 minutes, they observed the foraging activity of the fathead minnows and recorded whether they used the high-risk feeder closer to the perch’s tank or the low-risk feeder (experimental set-up is shown in Figure 1). These foraging behaviors were compared for minnows at different temperatures (41ºF, 59ºF, 73ºF).
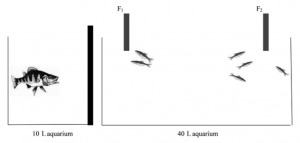
Figure 1. The experimental set up of temperature effect on predator-prey interactions is depicted in the diagram. Fathead minnows were kept in one tank, which was placed close to a separate tank with the yellow perch. Two feeding devices were used: the one closer to the yellow perch tank was considered the high-risk feeder and the one further way, the low-risk feeder. For trials where no predator is present, a divider between the tanks was used to hide the predator.
Results
These experiments showed that temperature significantly influenced the foraging and activity rates of the fathead minnows. The fish exposed to warmer temperatures were more active and foraged more frequently (Figure 2). Although the presence or absence of the predator did not influence foraging rates, it did influence which feeder the fish chose, with more fish choosing the low-risk feeder when the predator was visibly present (Figure 3). However, as the temperature increased for the different treatment groups, more minnows were observed foraging at the high-risk feeder (Figure 3).
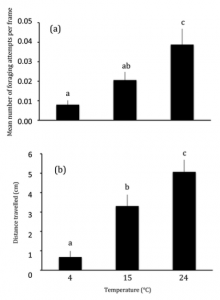
Figure 2. This graph shows that in warmer water the fathead minnows fed more often and were more active.
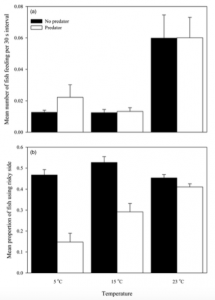
Figure 3. The graphs compare the response of the fathead minnows exposed to different temperatures to the presence and absence of the yellow perch. The top graph (a) shows that temperature did not affect whether the fathead minnows fed at the high-risk feeder or at the low risk feeder. The bottom graph (b) shows that with the predator visibly present, the fathead minnows preferred to feed at the low-risk feeder at cooler water, but in warmer water, they discriminated less between the feeders.
Outcomes
This study shows that temperature influences how much risk of predation is weighed in a fish’s decision to forage. At higher temperatures, fish are hungrier due to higher metabolic rates and are more likely to risk predation in order to feed because they don’t want to die of starvation. Predators have the potential to affect the structure of ecosystems both through their foraging as well as their effects on the behavior of their prey. Better understanding these prey-predator interactions and how environmental factors, such as temperature, influence them is critical in understanding ecosystem dynamics and predicting ecosystem responses to future environmental changes.
Reference
Pink, Melissa, and Mark V. Abrahams. “Temperature and Its Impact on Predation Risk within Aquatic Ecosystems.” Canadian Journal of Fisheries and Aquatic Sciences 73.6 (2016): 869-76.