The Study of Humpback Whale Songs as Indicators of Migratory Routes
By: Meagan Ando, SRC Intern
The migration of the Humpback Whale is one of the longest and mightiest journeys taken by any marine animal in the world. On average, these baleen whales travel about 6,000 miles every year, making this one of the most awe-inspiring ocean crossings. But just where do these animals travel to and how do we know?
Scientists have already set out to identify these tracks. A well-known method is through the identification of a specific animal via photographical evidence of the underside of the tail fluke. Each tail has a distinct pattern that serves the whale in the same way that a fingerprint does to a human: personal identity (Figures 1 and 2). Because of this, scientists are able to take pictures of these markings and compare them to pictures from prior years to match-up certain animals and analyze where they have been traveling to or from. From this data, it was proven that animals “migrate from summer feeding grounds in temperate or polar waters to winter breeding and calving areas in the tropics” (Kellogg 1929). However, it was still unclear as to which routes were being taken by the animals between these beginning-and-end locations.
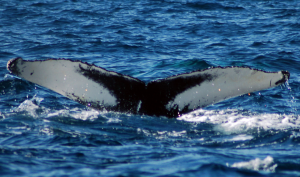
Figure 1: The close-up of the underside of a Humpback Whale tail located in Cape Bay, Newfoundland. This is a sign that the animal is diving (Nilfanion 2008).
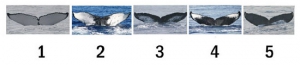
Figure 2: Photographs of five different whale flukes that vary in markings. This helps with the identification process (NOAA 2017).
In an effort to locate these specific routes, scientists turned to acoustic detections of the famous Humpback Whale songs. Each song consists of a highly-patterned series of different sounds that last anywhere from 6-35 minutes in length (Winn 1978). Identification of each individual animal was also made extremely possible because “each individual adheres to its own song type” (Payne and Mcvay 1971). While it was known that males usually produce these songs near their breeding grounds, it was also thought that they “sing along migration routes and on higher-latitude feeding grounds” (Vu et al., 2012). This hypothesis was further supported by the fact that for many years, while it was believed that “humpback whale singing was confined to tropical waters, […] singing [was] also documented with some frequency on migratory routes” (Clapham & Mattila 1990; Norris et al. 1999; Charif et al. 2001).
To test the theory of using songs as indicators of the whales’ migration routes, researchers used methods in which they could detect the songs throughout various parts of the ocean in order to successfully pinpoint where the animals were. It was previously known that Humpbacks from all populations migrated from many areas to a common ground in the West Indies to breed (Katona and Beard 1990). So, researchers set out on a cruise across the Atlantic Ocean to the Georges Bank area near Cape Cod, MA, USA to take a 25-day period recording using various pop-up acoustic monitoring systems (Clark and Clapham 2004). A pop-up is an autonomous acoustic recording system that measures sound waves through the use of a hydrophone and acoustic transponder. During the Spring of 2000, six of these instruments were deployed in the Bank area (Figure 3).
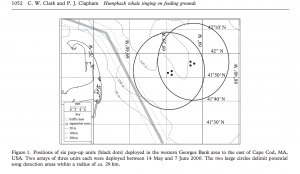
Figure 3: The locations of all six pop-up deployments in the western Georges Bank area. Data was recorded from these instruments from May 14, 2000 to June 7, 2000 (Clark and Clapham 2004).
The recording frequency ranged from 20-800 Hz, giving it a greater ability to detect the lower frequency range that male Humpback Whales sing at. After 25 days, this data was synchronized into six-channel data files and analyzed for presence/absence of singing as well as an estimate of the total number of whales singing at any given time (Figure 4). The range at which the sound waves were coming in was also a good indicator of distance from the acoustic pop-ups, allowing for pinpointed location of the whale’s track.
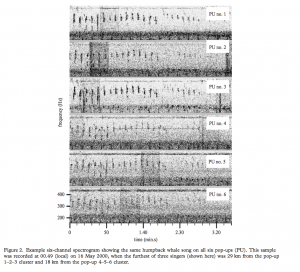
Figure 4: The six-channel data files’ spectrogram. This data shows the presence of the same song at all six locations, allowing for the conclusion of the direction in which the whale was traveling (Clark and Clapham 2004).
Researchers found that singing was detected during each hour of the day, giving a greater sample size and therefore more accurate data to draw conclusions from pertaining to the whales’ tracking pattern. The farthest locations detected were calculated to be 14-29 km away from each pop-up. They were also able to match up specific songs with specific animals to confirm that the mating season was still in session. This contradicted what many scientists had already believed about this breeding range. They suspected that breeding did not occur in such high latitudes. However, they were now able to conclude that “breeding season should no longer be considered as strictly confined to lower-latitude regions” (Clark and Clapham 2004).
In reference to migratory patterns, this data shows that Humpback Whales do in fact travel through areas that scientists are yet to expect. While tail fluke identification is a strong method for classification and should continue to be a way in which to pinpoint specific animals to assess health and areas of necessary protection, “many result from opportunistic or ‘casual’ encounters with animals”, which can end up being quite unreliable (Buckland 1990). Acoustic readings of songs can serve in more a successful way in order to know where specifically each population travels.
With continued research using acoustic monitoring such as the type used in this study, more specific locations can be identified in hopes of further protecting these animals. This methodology can also be applied to other species of cetaceans, allowing for researchers to locate where in the oceans they are breeding and strictly protect the area to allow for higher reproduction and survival rates.
Work Cited:
Buckland, S. T. “Estimation of survival rates from sightings of individually identifiable whales.” Report of the International Whaling Commission (special issue 12) (1990): 149-153.
Charif, R., Clapham, P. J., Gagnon, W., Loveday, P. & Clark, C. W. “Acoustic detections of singing humpback whales in the waters of the British Isles.” Mar. Mammal Sci. (2001). 17, 751–768.
Clapham, P. J. & Mattila, D. K. “Humpback whale songs as indicators of migration routes.” Mar. Mammal Sci. (1990). 6, 155–160.
Clark, Christopher W., and Phillip J. Clapham. “Acoustic monitoring on a humpback whale (Megaptera novaeangliae) feeding ground shows continual singing into late Spring.” Proceedings of the Royal Society B: Biological Sciences 271.1543 (2004): 1051.
Katona, S. K. & Beard, J. A. “Population size, migrations and feeding aggregations of the humpback whale (Megaptera novaeangliae) in the western North Atlantic Ocean.” Rep. Int. Whal. Commiss. (1990). 12: 295–305.
Kellogg, R. “What is known of the migrations of some of the whalebone whales.” A. Rep. Smithson. Inst. 1928, (1929). pp. 467–494.
Nilfanion. “User:Nilfanion.” Category: Heidentor (Carnuntum) – Wikimedia Commons, Wikimedia Foundation, Inc., 28 July 2008.
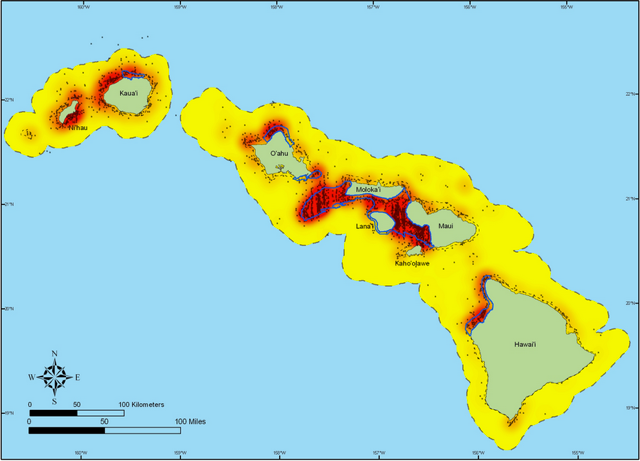
NOAA. Hawaiian Island Humpback Whale National Marine Sanctuary. National Ocean Service, 31 July 2017.
Norris, T. F., McDonald, M. & Barlow, J. “Acoustic detections of singing humpback whales (Megaptera novaeangliae) in the eastern North Pacific during their northbound migration.” J. Acoust. Soc. Am. (1999). 106, 506–514.
Payne, Roger S., and Scott McVay. “Songs of humpback whales.” Science 173.3997 (1971): 585-597.
Vu, Elizabeth T., et al. “Humpback whale song occurs extensively on feeding grounds in the western North Atlantic Ocean.” Aquatic Biology 14.2 (2012): 175-183.
Winn, H. E., and L. K. Winn. “The song of the humpback whale Megaptera novaeangliae in the West Indies.” Marine Biology 47.2 (1978): 97-114.