The Effects of Climate Change on Top Predator Distribution

by Jon Dorsey, RJD Intern

Climate change is a major concern that has been facing humankind for quite some time. Sea surface temperatures are predicted to rise between 1 – 6 degrees Celsius by 2100 and the consequences of this world-wide climate alteration include a loss of species richness, habitat shifts, and certain species endangerment. To measure the potential changes in habitat shifts of marine predators, the Tagging of Pacific Predators (TOPP) program designed an experiment where they would tag different Pacific marine predator species and track their behavior and migration patterns from 2000 – 2009. Along with the species tracking, they used functions of sea surface temperatures, chlorophyll A, and bathymetries to consolidate models that could allow the prediction of major marine predator habitat changes up until the year 2100. With this collected data, baselines would be set for which species require special management and which critical ecosystems are most at risk.

This diagram depicts the relative densities of top predators from 2001 -2009 In the Eastern Pacific Ocean.

The TOPP program chose to follow top predators because of the essential role they play in their environments. These predators provide a system of top-down control of ocean food webs and chains. Therefore, when a species is removed due to an environmental change, the stability of that marine ecosystem is jeopardized due to the resulting changes in the trophic cascade. The TOPP program collected sufficient results from 15 predator species and analyzed their individual tracks. Patterns in biodiversity indicated a northward movement in the core habitat, as a result of the northward swing of the NPTZ (North Pacific Transition Zone) and the richness decreased by 20%. In order to acclimate to these habitat shifts, predators were forced to live in unfamiliar environments in which not all of the species adapted well.

Predators within the shark, marine mammal, and turtle guilds have all shown declines in their new potential core habitats. The shark guild showed the most radical pelagic habitat loss with 3 out of every 4 species showing declines. Other species such as loggerhead turtle and blue whales also exhibited declines in their core habitats. One potential explanation is that these species have a lower capacity for adaptation due to their specialized diets. Their new environments may not cater to their specific diets which can cause an improper balance of nutrients in their diets. These decreases are alarming and it forces us to come up with potential ways to maintain stable predator populations.

These graphs display the predicted quarterly changes of population density for the tagged marine predators over the next century.

A primary way to maintain a healthy ecosystem should be to implement a system of marine ecosystem conservation and manage it proactively. The effects and rates of how the climate changes will impact different ecosystems will not be uniform. Therefore, it is crucial that we identify biodiversity hotspots that are at risk. Due to the shifting habitats, protected areas that would be oriented to transient oceanic features are being proposed. What this means is that areas where eddies, fronts, and upwellings are known to exist will be under a protected law due to the unstable and ever-changing dynamics. Climate change is a phenomenon affecting the whole planet and we must take preventative actions and develop recovery plans to protect the top predators that play vital roles in maintaining equilibrium in the marine environment.

REFERENCES:

Hazel, E et al. (2012). Predicted habitat shifts of Pacific top predators in a changing climate. Nature Climate Change

Rogue Waves

by James Komisarjevsky, RJD Intern

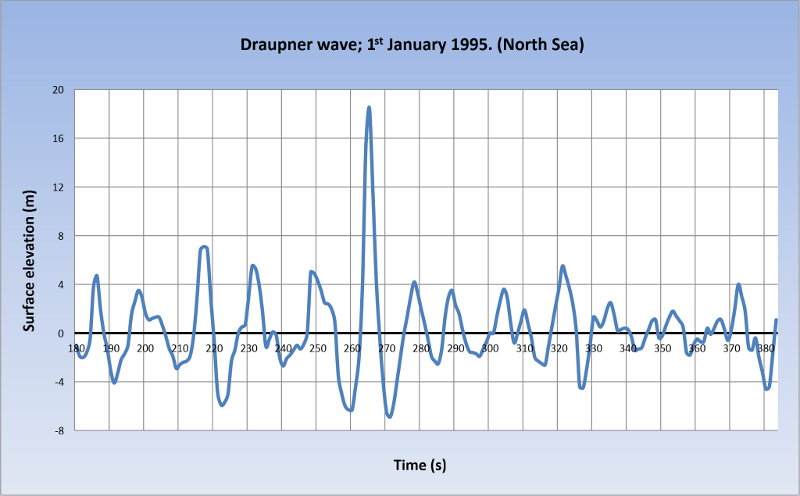
Imagine being out on a ship and facing a 60 meter high wave. An extremely large wave like that is known as a rogue wave. Rogue waves can be anywhere from two or more times higher than the average wave crest. They can be anywhere from 20 meters to 60 meters high. As one can imagine they have also taken up the name of “killer waves” (Bludov et. Al, 2009). For centuries, seafarers have been telling tales about giant waves which were capable of sinking ships and then disappearing without a trace. It wasn’t until recently that these tales were started to be believed when the first rogue wave was documented in 1995 on an oil platform in Norway (Figure 1) (Solli et. Al, 2007). In the following years, a program developed called “MAXWAVE”, showed that rogue waves with heights of 25 meters were actually common occurrences (Bludov et. Al, 2009).

This graph shows the surface elevation for the rogue wave that was recorded on an oil platform in Norway 1995. The surface elevation for the rogue wave is near 20 meters and in this cause the surface elevation more than doubled. (Picture source: http://commons.wikimedia.org/wiki/File:Draupner_wave(800x496px).png).


Read more

Marine protected areas: a viable conservation approach for wide ranging species?

by Fiona Graham, RJD Intern

Marine protected areas (MPAs) are regions of the ocean that have been zoned off and designated a level of protection. Different levels of protection can be offered by these zones, for example a no take zone, where regulations in that area do not permit fishing of any kind. Another example is a research only area, where recreation and commercial activities are not allowed.

While MPAs are effective at employing ecosystem-based management as a conservation tool, these networks of protected zones must be carefully chosen. MPAs function best as a well-connected group of distinct patches (a spatial network), each working to supplement the benefits of another, rather than as independent zones. Therefore, strategic area placement and size is crucial for the best conservation outcome. MPAs operating as ecologically cohesive networks should perform a variety of functions, including interacting with and supporting the surrounding environment. They should also maintain the processes, functions and structures of the intended protected features across their natural range, and function synergistically as a whole, such that the individual protected sites are able to benefit from each other (Ardron et al. 2008).

Read more

The importance of forage fish

by Megan Piechowski, RJD Intern

The intermediate position of forage fish species in the food chain creates a high level of importance of their presence to the health and success of an ecosystem. Forage fish, like herring or anchovies, contribute directly to the commercial fishery economy through their direct catch and contribute indirectly through forage fish predator catch. Therefore Ellen Pikitch, Konstantine Rountos, and a team of researchers sought to quantify the environmental and economical benefit of forage fish and their predators.  This information can then be applied to managing the trade-off between fishing and conservational pressures such as how to design more effective management areas and more informed fishing quotas which appropriately balance the predator-prey relationship. Specifically, the team was interested in determining the benefit of forage fish to: the contribution to the production of all forage fish predators, forage fish fisheries (90% of this catch is used for fish meal or fish oil), and to the value of commercially important predator species determined by their dependence on the forage fish for food.

Forage fish are classified as species of fish that feed on small microorganisms and are the primary food source of marine predators including marine mammals, sea birds, fish and squid. The researchers used a set criterion to select a group of Ecopath models that contain data for global estimates of different groups of forage fish and their dependent predators. This information was combined with global catch values (ex-vessel price) to determine the economic impact of the forage fish and forage fish predators. The research group separated the data into three latitudinal regions and seven ecosystem types; which allowed them to compare values and determine patterns (figure 1). Predators were classified by how important forage fish are to their diets – the most extreme classification consisting of a diet 75-100% reliant on forage fish.

Read more

Coral Reef Management in a Changing Climate

by Laurel Zaima, RJD Intern

Ecological disruptions have been occurring at an alarming rate and have been affecting many sensitive marine organisms. Fortunately, the coral reefs have been fairly resilient to the climate change; however, these disturbances have created a high demand for solutions to conserve the resilience of the coral reef. The scientists of the Prioritizing Key Resilience Indicators to Support Coral Reef Management in a Changing Climate conservation research paper conducted experiments in an Indonesian protected area to understand the coral reef’s level of resilience and the human power to help the coral’s resilience and recovery to the climate changes. The definition of resilience is “the capacity of an ecosystem to absorb recurrent disturbances or shocks and adapt to change while retaining essentially the same function and structure” (McClanahan et. al., 2). Resistance and recovery are the focus of the experiment because they are tangible aspects of resilience.

Read more

The Overfishing of Mediterranean Bluefin Tuna

by Dani Escontrela, RJD Intern

Bluefin tuna is the most valuable fish species in the world. Their numbers, however, have greatly decreased in recent years due to their high demand. In fact, in 2001 “one 202 kilogram bluefin tuna caught off the northern coast of Oma, Japan sold at the Tsukiji market for 862 USD/kg” (Shamshak et al 2009). The bluefin tuna has life history traits that make it more susceptible to overfishing: they reproduce at a later age, they reproduce when they are of larger size, and they aggregate when they are going to spawn (Longo et al 2012). In addition, like many other species in the ocean, they are susceptible to industrial pollution. As the fishing of this species has continued without many regulations to protect them, their numbers have greatly declined. In fact the International Commission for the Conservation of Atlantic Tuna (ICAAT) predicts that a collapse in the fish stock in the near future is inevitable (Longo et al 2012).

Read more

Impending bloom: Human impacts on the marine environment

by Stacy Assael, RJD intern

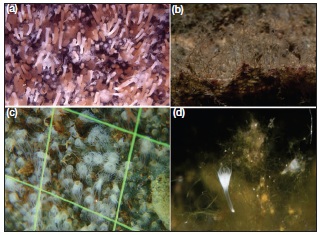
Ever wonder how mankind has contributed to the increase of jellyfish? Well, a recent study by Carlos Duarte et. al. (2012) has suggested that the large amounts of man-made structures/materials popping up in our world’s oceans may be providing artificial substrates for jellyfish polyps to attach to. Prior research on this subject matter has primarily focused on the adult stage of a jellyfish’s’ life cycle, and has attributed the increased occurrence of jellyfish blooms to a decrease in predation, climate change, and higher concentrations of nutrient rich water.However, this study indicates that man’s contribution is happening sooner in the jellyfish life cycle rather than later.

Figure 1 from Duarte et al. 2012. “Photographs of jellyfish polyps attached to artificial structures. (a) Strobilating polyps of Aurelia labiata attached to a marina float in Cornet Bay, Washington State (5 cm × 7 cm; from Purcell et al. 2009); (b) hydroids of Obelia dichotoma attached to plastic debris in the Ebro Delta, Spanish Mediterranean; (c) polyps of A aurita attached to a floating pier in the Inland Sea of Japan (2.3 cm × 3 cm); and (d) polyp of Cotylorhiza tuberculata attached to sunken piers in abandoned aquaculture concessions in the Mar Menor, Spanish Mediterranean.”

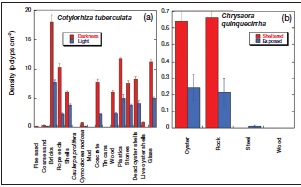
For this experiment, two different species of jellyfish, Chrysaora quinquecirrha, native to the Chesapeake Bay, and Cotylorhiza tuberculata, primarily found in the Mediterranean Sea, were exposed to different artificial and natural substrates. When exposed to the variety of materials, polyps showed a preference for artificial substrates. The results of this experiment are consistent with observational studies off the coast of Europe and Asia which show polyp colonies exceeding numbers of 10,000 individuals per meter squared on manmade structures.

Figure 2 from Duarte et al. 2012. “Experimental assessment of jellyfish planula settlement on different substrates for (a) Cotylorhiza tuberculata from the Mediterranean Sea and (b) Chrysaora quinquecirrha from Chesapeake Bay. Bars represent mean ± standard error polyp density on different substrates and conditions (red and blue bars). Settlement differed significantly among substrates for both species (ANOVA, P < 0.0001; WebTable 1). Settlement of C tuberculata was highly successful on hard substrates, particularly on smooth artificial surfaces including glass, plastic, or bricks, and in the dark (ANOVA, P < 0.0001; WebTable 1). Numbers of C quinquecirrha polyps were similar on oyster shells, their natural habitat, and stones (t test, P = 0.97) and significantly higher (t test, P < 0.005) on recruitment panels spaced closely to exclude large predators as compared with more exposed panels. “

These results spark concern due the large increase of aquaculture pens, docks, seawalls etc. in our coastal waters. Artificial structures such as these appear to be playing a more pivotal role in areas comprised of mostly soft sediments which are not conducive to jellyfish polyp attachment. In addition to providing a place to adhere, these structures are also sheltering the young jellyfish from the harsh marine conditions. Therefore, more jellyfish are able to survive into adulthood.
It would be useless to suggest that humans abandon our outward expansion into the marine environment. However we must find a creative solution that is advantageous to man without disrupting the natural order of the underwater ecosystem. Although this is a bold statement, small modifications such as altering the design of coastal structures and reducing the amount of plastic waste in the ocean may reduce the occurrence of jellyfish blooms.

References

Duarte, C. et al. (2012).  Is global ocean sprawl a cause of jellyfish blooms? Frontiers in Ecology and the Environment

Can the leatherback sea turtle be saved? An optimistic outlook

by Brittany Bartlett, RJD Intern

Many species that have been present on this planet for millions of years now face the possibility of extinction within the near future due to human activity. Among these species with uncertain futures is the leatherback sea turtle; a species some scientists believe may go extinct within our own lifetime (Spotila et al 1999).
All species of sea turtle found within the eastern Pacific Ocean are listed as vulnerable, endangered or critically endangered by the International Union for the Conservation of Nature. However, the critically endangered leatherback sea turtle faces the harshest reality due to its’ complex life history (slow growth rate, late reproduction, highly mobile movement), which complicates protection efforts. If the leatherback’s rapid rates of decline persist, scientists estimate that the global population of leatherbacks will be functionally extinct within the next few decades (Spotila et al. 1999).
So, why are leatherbacks so vulnerable to extinction, and is it possible to mitigate these threats to allow these incredible species to prevail?

Leatherback sea turtle on beach, By Steve Garvie from Dunfermline, Fife, Scotland (LEVIATHAN) [CC-BY-SA-2.0 (via Wikimedia commons)

Leatherbacks face many human induced threats, such as loss of habitat due to development, pollution, and overhunting. However, one threat of primary concern is the incidental takes of leatherbacks at sea in fisheries (bycatch). Leatherbacks are often caught at sea and killed accidently in fishing gear that is intended for other species. It is vital to minimize these dangerous fishing practices, such as longline and passive net fisheries.
Longlining is a fishing practice that consists of one large, primary horizontal line at the surface of the water, attached to hundreds (or thousands) of additional vertical lines with baited hooks that can reach depths of 400 meters. In 2000, approximately 1.2 billion longline hooks were used globally; 52% of these hooks were in the Pacific. Therefore, a high opportunity exists for the Pacific leatherback to bite and/or get caught in a line in passing (Gilman et al 2006).
Passive net fisheries are unselective fishing practices that utilize large, easy to use, cost effective nets. Fishermen deploy these nets in the ocean at various depths in attempts to catch various species of pelagic and coastal fish passing through. Sea turtles can become entangled and trapped in these nets, oftentimes resulting in drowning (Gilman 2009).
Although, this may seem grim, hope does exist. Fishing practices simply need to become more sustainable and consider sea turtle characteristics and behavior.
Time area closures may be one of the most efficient and feasible ways to reduce sea turtle bycatch within the Pacific. Satellite tagging operations have concluded the whereabouts of the highly migratory leatherbacks at different times of the year. For example, leatherbacks are present in the California Current System in the summer and autumn months due to an increase of jellyfish (their primary food) within the area (Bailey et al 2012). Restricting commercial fishing within this area from July to November can reduce the amount of sea turtle bycatch. One successful closure in the Oregon and California waters for loggerhead sea turtles foraging on red crabs was implemented and resulted in 0 reported bycatch for that season (Shillinger et al 2008)!
When fishing cannot be avoided, gear modification is the next best option. Currently, the fishing gear and strategies implemented by commercial fishermen are designed to catch the highest amount of fish at the lowest cost and per unit effort. This approach is often unsustainable, but modifications of these current practices can partially mitigate the incidental take of leatherback sea turtles.
With regards to longline fisheries, a change in hook type and bait could be a simple mechanism to reduce bycatch. Fishermen tend to use J hooks as opposed to C hooks (the C hook has a smaller, more inward gap then the J hook). Studies show that a hook with a gap less than 4.6cm can greatly reduce the amount of bycatch that is caught. Therefore, a shift from J hooks to C hooks has the potential to decrease leatherback bycatch by 75% (Gilman 2006).

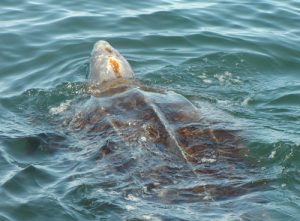
A swimming leatherback sea turtle. By Scott R. Benson, NMFS Southwest Fisheries Science Center [Public domain], via Wikimedia Commons

A change in bait, from squid to mackerel, can be another effective strategy to reduce sea turtle bycatch. Studies show that when fishermen switched their bait from squid, there was an 88% reduction in leatherback bycatch (Gilman 2006). Also, mackerel does not hold on a hook as strongly as squid; therefore, if the bait is eaten, there is a smaller chance of a sea turtle choking on the hook.
The unselectively of passive nets could be modified in many ways. Two of the more recognized modifications are a reduction in the net profile and a change in net mesh size. A low profile net is half the depth of typical gillnets, reducing the amount of net within the water and opportunity for entanglement. The mesh size of a net influences the amount of non target species caught; reducing mesh size so sea turtles will not get caught can reduce bycatch by 32% (Gilman 2009).
As you can see, solutions do exist. The ones stated here are only a few of many possible options. Unfortunately, protection efforts and action to reduce the amount of leatherbacks caught in fishing gear is limited. This can, in some regards, be attributed to a lack of public concern and pressure. It is our responsibility to educate ourselves about current conservation efforts, raise awareness, and take action. It is in our hands to help inspire change and support efforts to increase protection for the critically endangered leatherback sea turtle.

REFERENCES

Gilman, E. et al. (2009) Mitigating sea turtle by-catch in coastal passive net fisheries. Fish and Fisheries

Gilman, E. (2006). Reducing sea turtle bycatch in pelagic longline fisheries. Fish and Fisheries 7, 2-23.

Shillinger, G. et al. (2008). Persistent Leatherback Turtle Migrations Present Opportunities for Conservation. Plos Biology 6, 1408-1416.

Spotila et al. (1999). Description of the Eastern Pacific High Seas Longline and Coastal Gillnet Swordfish Fisheries of South America, including Sea Turtle Interactions, and Management Recommendations. Sea Turtle Restoration Project.

Bioaccumulation & Biomagnification: When Bigger Isn’t Better.

by Becca Shelton, RJD Intern

Ever wonder why you have to limit certain types of seafood? Or why you should not eat certain types of seafood? Today, I will help answer these questions with scientific research. As an avid ocean enthusiast and lover of sustainable seafood, it is crucial to understand what is floating around in the water with marine life. And these potential health issues are not just restricted to humans! Marine fauna are also negatively affected by bioaccumulation and biomagnification, especially apex predators like sharks, seals/sea lions and killer whales. This post is going to briefly touch some of the different ways bioaccumulation and biomagnification affect marine apex predators and us.
The easiest way to understand how bioaccumulation and biomagnification work is to use them in a food chain scenario. Bioaccumulation begins at the first level of a food chain where there is an increase in the concentration of a pollutant from the environment to the first consumer (i.e. pollutants to plankton to filter feeder). It can also refer to the amount of toxins in individual animals because as a top predator consumes multiple, contaminated food sources, it will “accumulate” more toxins. Biomagnification occurs when the concentration of a pollutant increases from one link in the food chain to another (i.e. polluted fish will contaminate the next consumer and continues up a tropic food web as each level consumes another) and will result in the top predator containing the highest concentration levels. In order for biomagnification to occur, a pollutant must be long-lived, mobile, soluble on fats and biologically active (http://www.marietta.edu/~biol/102/2bioma95.html). Examples of these types of pollutants include DDT, polycholorinated biphenyls (PCBs), heavy metals (mercury, lead, chromium, etc.) and β-Methylamino-L-alanine (BMAA). In high enough concentrations, these toxins can lead to serious health issues for marine fauna and humans.
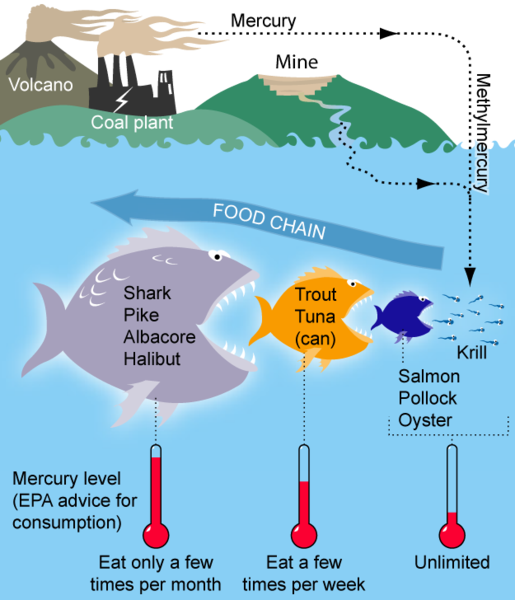
Basic diagram of how Mercury bioaccumulates and biomagnifies within a marine food chain, WikiMedia commons

Sharks are particularly susceptible to contamination uptake and bioaccumulation due to their long life spans, high position in a food web and large, lipid-rich livers (Mull et al., 2012). In the scientific paper, Heavy metals, trace elements, and organochlorine contaminants in muscle and liver tissue of juvenile white sharks, Charcharodon carcharias, from the Southern California Bight, by Mull et al., 2012, scientists were looking at toxic loads in white sharks and trying to determine if high levels of contaminants were caused by age/length or geographical trends. They found that high contamination levels in the sharks are directly linked with geographical areas that contained high levels of pollutants. Mull et al. also found that the average total mercury level in white sharks was six times higher than the established wildlife screening value of concern. These scientists also discovered that young of the year (YOY) white sharks from the Southern California Bight exhibited the highest liver levels of PCBs and DDT when compared to older white sharks or any other elasmobranch (sharks and rays) ever recorded! It is hard to believe that white sharks that are only one year old are carrying around enough toxins in their bodies that could cause sublethal effects including behavioral alterations, emaciation, cerebral lesions, and impaired gonad development (Wiener et al., 2003).


White shark toxin levels have been linked to geography and diet, making certain populations more susceptible to bioaccumulation. WikiMedia commons

In the paper Mercury bioaccumulation in the spotted dogfish (Scyliorhinus canicula) from the Atlantic Ocean by Coelho et al., 2010, scientists looked at the bioaccumulation pattern in different tissues in the spotted dogfish and the risks associated with its consumption because it is an ecologically important species. They found that the highest levels of mercury were in the muscle and that there was no significant difference in the concentrations between genders but was highest in the mature females. I found this to be very fascinating as I have heard several talks on toxic offloading and expected the opposite to occur. Toxic offloading is the process when a mother animal passes along toxins from its body to the developing offspring, thereby reducing its personal concentration levels. The key to this process is what type of reproduction the sharks possess. When a shark is ovoviviparous (eggs are produced inside the body but are then born via a live birth), there is limited mercury transfer because the eggs do not require extra nutrition during development. In viviparous species (live birth) there is pollutant transference along with the nutrients the mother sends to the embryos. Spotted dogfish are ovoviviparous and therefore the mother retains the majority of the toxins.
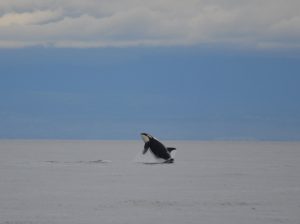
Sharks are not the only group that has to worry about toxic offloading. Marine mammals have had adverse effects to bioaccumulation and toxic offloading. In Haraguchi et al., 2009, Accumulation and mother-to-calf transfer of anthropogenic and natural organohalogens in killer whales (Orcinus orca) stranded on the Pacific coast of Japan, scientists tested the blubber of nine stranded killer whales and found that the concentrations of pollutants was higher in calves than lactating females. This indicates that large quantities of anthropogenic and natural persistent organohalogens (like DDT and PCBs) we being transferred from the mother to the calf via lactation. Now new born calves are starting with these high toxin loads and the effects of these elevated concentrations on the animal’s health and reproduction is unknown but may have been one of the causes of the strandings.
I know this all seems very “doom and gloom” but the more people are aware of these issues, the sooner we can make positive changes for our oceans and our health. One the easiest ways to avoid bioaccumulation of toxins in your seafood is to educate yourself about safe options. I love Monterey Bay Aquarium’s “Sustainable Seafood Watch Guide” which can be found on their website at http://www.montereybayaquarium.org/cr/cr_seafoodwatch/download.aspx. There is also an iPhone app, which is really convenient. Once you pick a region, you can view the best choices in sustainable seafood and which types of seafood are prone to mercury and other contaminants. You will see that some of the best choices have the little red star indicating possible contamination. These fish are to be limited in the quantity consumed by individuals per month. Sustainable seafood does not mean stop eating seafood, but rather a guideline towards making healthy choices for yourself and our oceans. Just like in the paper Mull et al., 2012, knowing where your seafood originates from can make all the difference when trying to determine seafood pollution levels. Different areas where seafood is harvested have varying types and levels of pollutants. Obviously the best option would be to stop the contaminants from entering the ocean in the first place but since a lot of these toxins originate as byproducts from consumer goods, it is easier to use the “3 R’s,” reduce, reuse and recycle. I could go on and on about ways to help the oceans but I hope this blog post has inspired you to do some research of your own and find at least one simple but effective way to make a difference. Every little bit counts.

REFERENCES

Coelho, J. P., Santos, H., Reis, a T., Falcão, J., Rodrigues, E. T., Pereira, M. E., Duarte, a C., et al. (2010). Mercury bioaccumulation in the spotted dogfish (Scyliorhinus canicula) from the Atlantic Ocean. Marine pollution bulletin, 60(8), 1372–5. doi:10.1016/j.marpolbul.2010.05.008
Haraguchi, K., Hisamichi, Y., Endo, T. (2009). Accumulation and mother-to-calf transfer of anthropogenic and natural organohalogens in killer whales (Orcinus orca) stranded on the Pacific coast of Japan. The Science of the total environment, 407(8), 2853–9. doi:10.1016/j.scitotenv.2009.01.003
Mull, C.G., Blasius, M.E., O’Sullivan, J.B., Lowe, C.G. 2012. Heavy metals, trace elements, and organochlorine contaminants in muscle and liver tissue of juvenile white sharks, Carcharodon carcharias, from the Southern California Bight. In Global perspectives on the biology and life history of the white shark (pp. 59-75). Domeier, M.L. Boca Raton, FL: CRC Press.
Wiener, J.G., Krabbenhoft, D.P., Heinz, G.H., Scheuhammer, A.M. 2003. Ecotoxicology of mercury. In Handbook of ecotoxicology, second edition (pp. 409-463). Hoffman, D.J., Rattner, B.A., Burton, G.A. Jr., Cairns, J., Jr. (eds.). Boca Raton, FL: CRC Press.

Bioaccumulation & Biomagnification: When Bigger Isn’t Better.

by Becca Shelton, RJD Intern

Ever wonder why you have to limit certain types of seafood? Or why you should not eat certain types of seafood? Today, I will help answer these questions with scientific research. As an avid ocean enthusiast and lover of sustainable seafood, it is crucial to understand what is floating around in the water with marine life. And these potential health issues are not just restricted to humans! Marine fauna are also negatively affected by bioaccumulation and biomagnification, especially apex predators like sharks, seals/sea lions and killer whales. This post is going to briefly touch some of the different ways bioaccumulation and biomagnification affect marine apex predators and us.
The easiest way to understand how bioaccumulation and biomagnification work is to use them in a food chain scenario. Bioaccumulation begins at the first level of a food chain where there is an increase in the concentration of a pollutant from the environment to the first consumer (i.e. pollutants to plankton to filter feeder). It can also refer to the amount of toxins in individual animals because as a top predator consumes multiple, contaminated food sources, it will “accumulate” more toxins. Biomagnification occurs when the concentration of a pollutant increases from one link in the food chain to another (i.e. polluted fish will contaminate the next consumer and continues up a tropic food web as each level consumes another) and will result in the top predator containing the highest concentration levels. In order for biomagnification to occur, a pollutant must be long-lived, mobile, soluble on fats and biologically active (http://www.marietta.edu/~biol/102/2bioma95.html). Examples of these types of pollutants include DDT, polycholorinated biphenyls (PCBs), heavy metals (mercury, lead, chromium, etc.) and β-Methylamino-L-alanine (BMAA). In high enough concentrations, these toxins can lead to serious health issues for marine fauna and humans.

Basic diagram of how Mercury bioaccumulates and biomagnifies within a marine food chain, WikiMedia commons

Sharks are particularly susceptible to contamination uptake and bioaccumulation due to their long life spans, high position in a food web and large, lipid-rich livers (Mull et al., 2012). In the scientific paper, Heavy metals, trace elements, and organochlorine contaminants in muscle and liver tissue of juvenile white sharks, Charcharodon carcharias, from the Southern California Bight, by Mull et al., 2012, scientists were looking at toxic loads in white sharks and trying to determine if high levels of contaminants were caused by age/length or geographical trends. They found that high contamination levels in the sharks are directly linked with geographical areas that contained high levels of pollutants. Mull et al. also found that the average total mercury level in white sharks was six times higher than the established wildlife screening value of concern. These scientists also discovered that young of the year (YOY) white sharks from the Southern California Bight exhibited the highest liver levels of PCBs and DDT when compared to older white sharks or any other elasmobranch (sharks and rays) ever recorded! It is hard to believe that white sharks that are only one year old are carrying around enough toxins in their bodies that could cause sublethal effects including behavioral alterations, emaciation, cerebral lesions, and impaired gonad development (Wiener et al., 2003).


White shark toxin levels have been linked to geography and diet, making certain populations more susceptible to bioaccumulation. WikiMedia commons

In the paper Mercury bioaccumulation in the spotted dogfish (Scyliorhinus canicula) from the Atlantic Ocean by Coelho et al., 2010, scientists looked at the bioaccumulation pattern in different tissues in the spotted dogfish and the risks associated with its consumption because it is an ecologically important species. They found that the highest levels of mercury were in the muscle and that there was no significant difference in the concentrations between genders but was highest in the mature females. I found this to be very fascinating as I have heard several talks on toxic offloading and expected the opposite to occur. Toxic offloading is the process when a mother animal passes along toxins from its body to the developing offspring, thereby reducing its personal concentration levels. The key to this process is what type of reproduction the sharks possess. When a shark is ovoviviparous (eggs are produced inside the body but are then born via a live birth), there is limited mercury transfer because the eggs do not require extra nutrition during development. In viviparous species (live birth) there is pollutant transference along with the nutrients the mother sends to the embryos. Spotted dogfish are ovoviviparous and therefore the mother retains the majority of the toxins.
Sharks are not the only group that has to worry about toxic offloading. Marine mammals have had adverse effects to bioaccumulation and toxic offloading. In Haraguchi et al., 2009, Accumulation and mother-to-calf transfer of anthropogenic and natural organohalogens in killer whales (Orcinus orca) stranded on the Pacific coast of Japan, scientists tested the blubber of nine stranded killer whales and found that the concentrations of pollutants was higher in calves than lactating females. This indicates that large quantities of anthropogenic and natural persistent organohalogens (like DDT and PCBs) we being transferred from the mother to the calf via lactation. Now new born calves are starting with these high toxin loads and the effects of these elevated concentrations on the animal’s health and reproduction is unknown but may have been one of the causes of the strandings.

I know this all seems very “doom and gloom” but the more people are aware of these issues, the sooner we can make positive changes for our oceans and our health. One the easiest ways to avoid bioaccumulation of toxins in your seafood is to educate yourself about safe options. I love Monterey Bay Aquarium’s “Sustainable Seafood Watch Guide” which can be found on their website at http://www.montereybayaquarium.org/cr/cr_seafoodwatch/download.aspx. There is also an iPhone app, which is really convenient. Once you pick a region, you can view the best choices in sustainable seafood and which types of seafood are prone to mercury and other contaminants. You will see that some of the best choices have the little red star indicating possible contamination. These fish are to be limited in the quantity consumed by individuals per month. Sustainable seafood does not mean stop eating seafood, but rather a guideline towards making healthy choices for yourself and our oceans. Just like in the paper Mull et al., 2012, knowing where your seafood originates from can make all the difference when trying to determine seafood pollution levels. Different areas where seafood is harvested have varying types and levels of pollutants. Obviously the best option would be to stop the contaminants from entering the ocean in the first place but since a lot of these toxins originate as byproducts from consumer goods, it is easier to use the “3 R’s,” reduce, reuse and recycle. I could go on and on about ways to help the oceans but I hope this blog post has inspired you to do some research of your own and find at least one simple but effective way to make a difference. Every little bit counts.

REFERENCES

Coelho, J. P., Santos, H., Reis, a T., Falcão, J., Rodrigues, E. T., Pereira, M. E., Duarte, a C., et al. (2010). Mercury bioaccumulation in the spotted dogfish (Scyliorhinus canicula) from the Atlantic Ocean. Marine pollution bulletin, 60(8), 1372–5. doi:10.1016/j.marpolbul.2010.05.008
Haraguchi, K., Hisamichi, Y., Endo, T. (2009). Accumulation and mother-to-calf transfer of anthropogenic and natural organohalogens in killer whales (Orcinus orca) stranded on the Pacific coast of Japan. The Science of the total environment, 407(8), 2853–9. doi:10.1016/j.scitotenv.2009.01.003
Mull, C.G., Blasius, M.E., O’Sullivan, J.B., Lowe, C.G. 2012. Heavy metals, trace elements, and organochlorine contaminants in muscle and liver tissue of juvenile white sharks, Carcharodon carcharias, from the Southern California Bight. In Global perspectives on the biology and life history of the white shark (pp. 59-75). Domeier, M.L. Boca Raton, FL: CRC Press.
Wiener, J.G., Krabbenhoft, D.P., Heinz, G.H., Scheuhammer, A.M. 2003. Ecotoxicology of mercury. In Handbook of ecotoxicology, second edition (pp. 409-463). Hoffman, D.J., Rattner, B.A., Burton, G.A. Jr., Cairns, J., Jr. (eds.). Boca Raton, FL: CRC Press.