Foraging energetics and prey density requirements of western North Atlantic blue whales in the Estuary and Gulf of St. Lawrence, Canada

By Nicholas Martinez, SRC intern

Pelagic predators throughout the world’s oceans face the same challenge: foraging for food in an environment where much of their prey are available in clusters, centralized around specific areas of the ocean. For this reason, many pelagic predators have unique ways to find these limited resources, all the while adjusting these foraging techniques so as to maximize energy gained for every unit of energy expended.

In a world where oceanic ecosystems are facing rapid change, the need for more research and implemented protective measures is rising. Many marine animals have been documented as having shifted their foraging habits because of a rapid decline in available resources. These resources, which have supported countless generations of predators, are now facing serious threats to their population size. For this reason, studies of the foraging habits of large marine predators allows insight into the hunting grounds that still remain for these animals. Understanding how often these species forage for food allows scientists to determine the health of a specific population of that species. A 2019 paper from Guilpin and colleagues, “Foraging energetics and prey density requirements of western North Atlantic blue whales in the Estuary and Gulf of St. Lawrence, Canada”, focused on the foraging efficiency of the North Atlantic blue whale in a quickly changing oceanic environment.


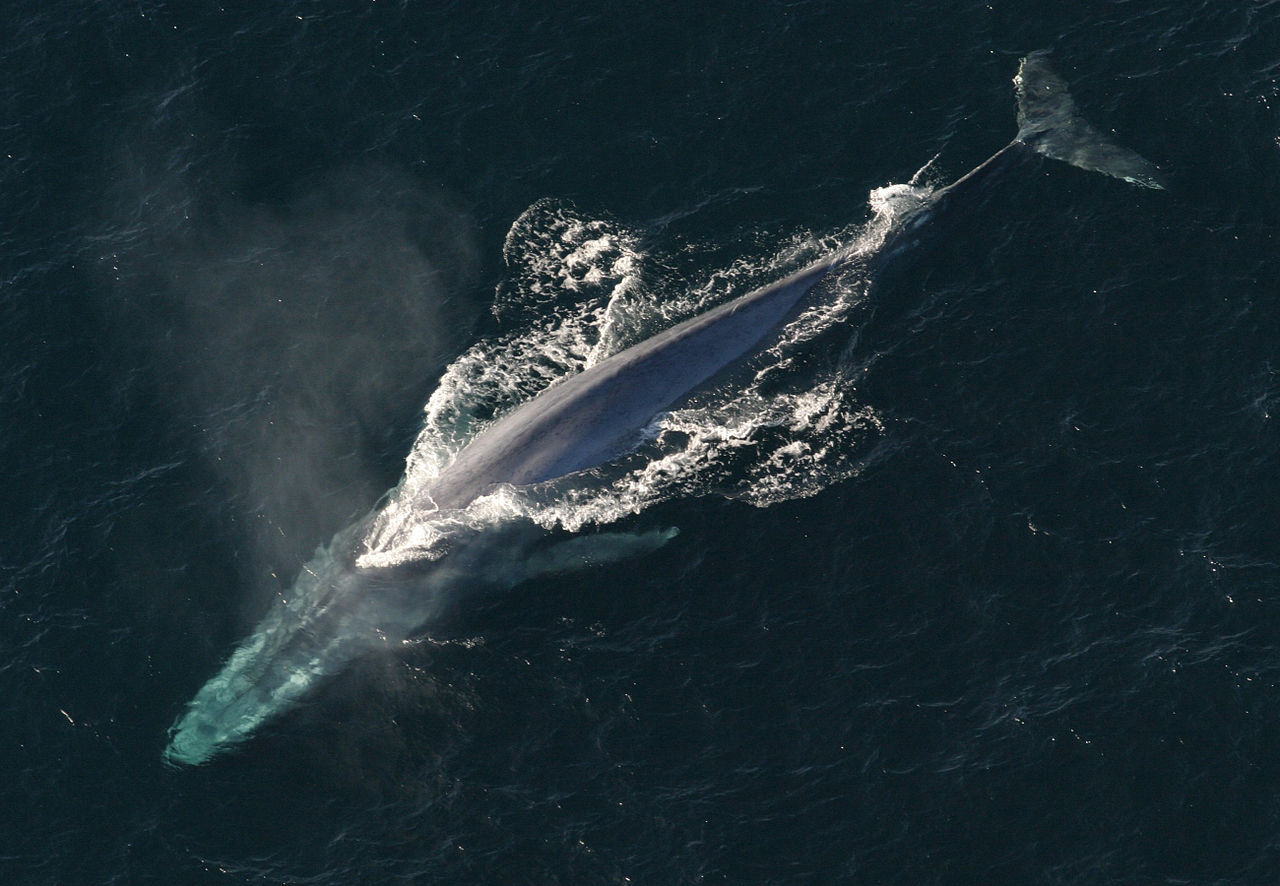
Figure 1. The blue whale (Source: NOAA Photo Library/anim1754/Wikimedia Commons)

Foraging efficiency is a ratio that compares the rate of energy consumption to the rate at which energy is expelled so as to provide insight into an organism’s ability to store energy. Understanding a blue whale’s capacity to store energy is crucial because there is a direct correlation between the animal’s energy supply and its ability to reproduce. Using 10 depth-velocity tags attached to the whales, the scientists were able to monitor the foraging behaviors of blue whales in the St. Lawrence Estuary. While blue whales are the largest living organisms on the planet, their food supply consists small invertebrates called krill, which can be found in large populations throughout the study site. This food source exhibits spatial and temporal variations and thus requires a specialized foraging technique in order to maximize the whales net energy reserve.


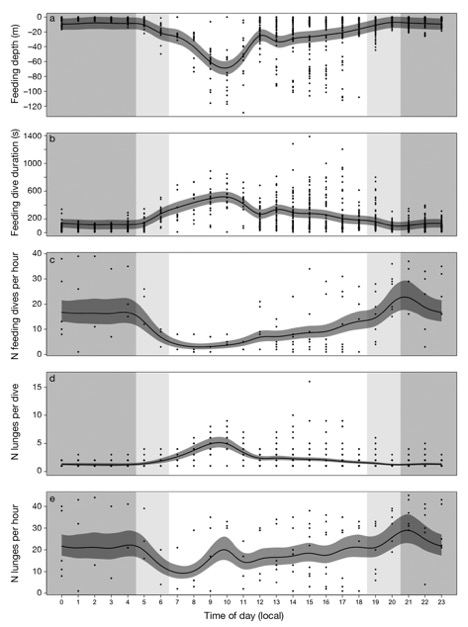
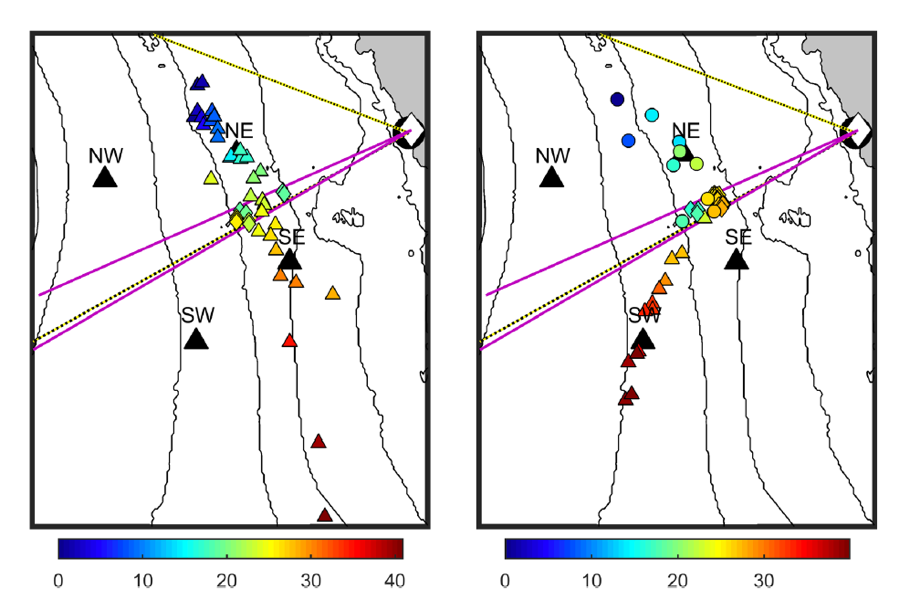
Figure 2. “Predicted change in blue whale foraging effort with time of day in (a) feeding depth (m), (b) dive duration (s), (c) number of feeding dives, (d) number of lunges d−1, and (e) number of lunges h−1. Dark grey ribbons represent the 95% confidence intervals around the predicted response from generalized additive mixed models. Shaded areas are for nighttime (grey), dusk and dawn (light grey), and daytime (white). Points are data observations” (Source: Guilpin et al. 2019, p. 213)

Here, the researchers found that during the day, the tagged blue whales performed fewer but longer feeding dives than at other times of the day (Figure 1). This suggested that the blue whales invested in fewer but longer dives so as to maximize the amount of energy they could store by minimizing energy expenditure (Figure 2). In addition, the authors found that the whales were performing more lunges per dive (accelerating towards the surface, trapping any krill in their mouth as they momentarily breach), showing that even while the whales were not deep diving, they were still feeding.


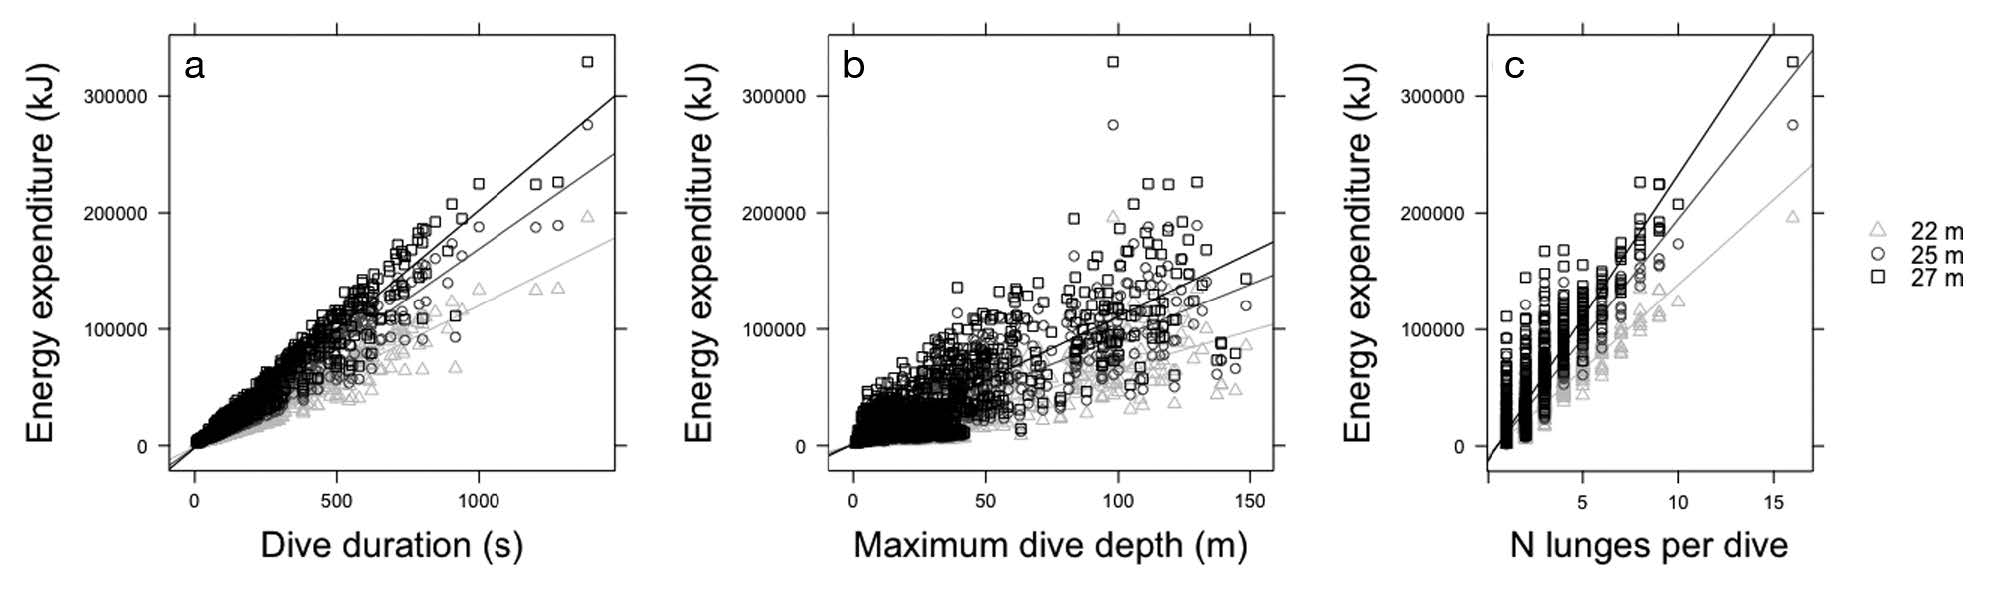
Figure 3. “Relationship between energy expenditure during feeding dives for 3 blue whale sizes (22, 25, and 27 m length) and (a) dive duration (s) … (b) maximum dive depth (m) … and (c) number of lunges per dive” (Source: Guilpin et al. 2019, p. 214)

Although the whales were observed to feed throughout the day, this did not necessarily mean that they were consuming enough krill to achieve a neutral energetic balance. In fact, this study found that only 11.7 and 5.5% of Arctic and northern krill patches contained densities that could sustain a neutral energy balance for the blue whales. This could be due to a decline of krill populations via environmental impacts, and if so, poses a great threat to blue whale populations. This information emphasizes blue whales’ constant need to forage for high densities of krill in order to maintain neutral energy balance or maintain a healthy energy storage suitable for reproduction. The discoveries made in this paper may therefore help predict the effects of climate change on both predator/prey densities and may also offer insight on potential krill fisheries and how they may or may not affect blue whale populations.

Work cited

Guilpin M, Lesage V, McQuinn I, et al (2019) Foraging energetics and prey density requirements of western North Atlantic blue whales in the Estuary and Gulf of St. Lawrence, Canada. Mar Ecol Prog Ser 625:205–223. doi: 10.3354/meps13043

Preventing ecosystems from feeling clammy: what monitoring giant clam populations can tell us about human perseverance

By Maria Geoly, SRC Intern

Every aspect of our lives depends on the health of our natural resources. Clean water, nutrient rich soil, and access to timber are often considered humanity’s three most essential natural resources because they provide the four essential needs of living things: oxygen, water, food, and shelter. Often overlooked, however, is the crucial role that animals play in maintaining healthy resources. A healthy ecosystem is comprised of many different components (Figure 1), that work in a checks and balances system to maintain harmony.

Figure 1. A depiction of how different organisms contribute to the balance of natural systems. (Source: https://www.sciencelearn.org.nz/resources/143-marine-food-webs)

Populations and demographics of the species comprising an ecosystem can be considered in decision toward ecosystem and resource management. The human implications of these decisions, however, are not always considered in the same way. An example of this comes from the Tuamotu atolls of French Polynesia, presented in a study from Georget et al. (2019).

The Tuamotu atolls used to have some of the largest populations of giant clams (Tridacna maxima) on Earth (Figure 2). Over thirty years, researchers had monitored the number of giant clams in this area –the ocean floor was divided into many squares or “quadrants” and giant clam individuals were counted within random squares, to estimate the number of animals in that habitat.

Figure 2. Giant clams, Tridacna maxima. (Source: National Oceanic and Atmospheric Administration)

From 2005-2012, hundreds of giant clams started dying off very quickly due to unusual weather patterns. The drastic change in population was observed by the atolls’ residents, however the method used by researchers to monitor population did not. This methodology, known as “LIT-Q” testing, is an accurate way to measure abundant species, but as a species’ numbers decline, “BT” sampling methods, which use one very long but thin quadrant at a time, tend to be more precise.

As scientists realized their mistakes, they decided to try both methods at once, in old and new giant clam habitats, to see if their past data was incorrect. Computer simulations were used to make models of both data sets, and scientists found that each testing method gave different estimates for each site, with “BT” sampling being the most accurate.

This study is important because it recognizes the need for flexibility and reflexivity in scientific practice. In Tuamotu and other remote fisheries across the globe, fishing quotas are determined by the estimated population densities of a species. If the numbers are off, unsustainable policy could be written that may lead to overfishing, harming entire ecosystems and the people who rely upon them. As in the case of Tuamoto, scientists actively questioned if what they were doing was right and used creative problem solving to fix past mistakes. The revaluation of what once worked helped the area recognize that overfishing of giant clams was occurring, and fishing quotas have since changed to support the sustained health both the giant clams and of the reef systems supporting them.

Persevering through the daunting task of fixing such a big data mistake is hard, but the reward that comes with new understanding and solutions to large problems like overfishing is well worth the struggle. Tuamoto serves as a global example of why scientific methodology should often be questioned and reevaluated. The long-term benefits are ecologically worth it.

Work cited 

Georget S, Van Wynsberge S, Andréfouët S (2019) Understanding consequences of adaptive monitoring protocols on data consistency: application to the monitoring of giant clam densities impacted by massive mortalities in Tuamotu atolls, French Polynesia. ICES J Mar Sci 76:1062–1071. doi: 10.1093/icesjms/fsy189

Mapping the global network of fisheries science collaboration

By Julia Saltzman, SRC intern

Collaboration is something which we all learn about as children. We are taught to work together in teams, to share our toys, and that ideas are better when many individuals contribute to them. As science has become increasingly internationalized, scholars investigating the shifting spatial structure have posed questions to whether networks of research collaboration are actually expanding despite the argument that broad-based collaboration is crucial to solving the challenges ongoing with respect to fisheries (Syed, ní Aodha et al. 2019). The global marine catch is approaching its upper limit, the number of overfished populations and the indirect effects of fisheries indicate that fisheries management has failed to achieve any sort of sustainability. This failure is primarily due to the continued increase in harvest rates in response to global pressure for greater harvests and the inability to accurately model sustainable catch amounts. Nevertheless, fisheries provide the direct employment to about 200 million people and account for nearly 19% of the total human consumption of animal protein (Botsford, Castilla et al. 1997). Fisheries are a crucial resource, and the only way to promote comprehensive management is with collaboration on a global level.

Figure 1: The global marine catch is approaching its upper limit, the number of overfished populations and the indirect effects of fisheries indicate that fisheries management has failed to achieve any sort of sustainability.

With the imperativeness of this collaboration in mind scientists mapped and examined the landscape of scientific collaboration across fisheries science. The results were quite interesting, the collaboration has become more extensive and more intensive in various places. However, the fisheries science landscape is one where the centers of knowledge production and the collaboration across scientists is far more regional than global. The regional manner of collaboration in fisheries science is likely to limit the potential benefits of collaboration. Collaboration which is regionally limited in such a global field will have consequences such as preventing the innovation which is necessary to address the ongoing challenges within fisheries management. There are several different aspects of fisheries management which can be learned from this study. First and foremost, collaboration on a global level is crucial for sustainable fisheries management. This collaboration should manifest itself in several different ways whether it be direct collaboration between various fisheries, collaboration among scientists who work in different fisheries, and collaboration among governments and fisheries management organizations.

Figure 2: Collaboration is something which we all learn about as children. We are taught to work together in teams, to share our toys, and that ideas are better when many individuals contribute to them. As science has become increasingly internationalized, scholars investigating the shifting spatial structure have posed questions to whether networks of research collaboration are actually expanding despite the argument that broad-based collaboration is crucial to solving the challenges ongoing with respect to fisheries.

Works cited

Botsford, L. W., J. C. Castilla and C. H. Peterson (1997). “The Management of Fisheries and Marine Ecosystems.” Science 277(5325): 509.

Syed, S., L. ní Aodha, C. Scougal and M. Spruit (2019). “Mapping the global network of fisheries science collaboration.” Fish and Fisheries 20(5): 830-856.

Climate variability and life history impact stress, thyroid, and immune markers in California sea lions (Zalophus californianus) during El Niño conditions

By Isabelle Geller, SRC intern

There are many situations which may increase the level of stress in an animal – for example, not being able to eat enough food to meet energy demands or being in temperatures above or below a tolerable range they can. DeRango et al. (2019) aimed to study both of these factors with respect stress levels of California sea lions (CSL) (Figure 1). Specifically, the authors looked at impacts of environmental change (e.g. variability over the course of the study) and life history (e.g. pre-breeding and post-breeding stages – juvenile and adult – with different energy demands) on CSL during the El Niño of 2015-2016.

Figure 1: California Sea Lion (Rhododendrites [CC BY-SA 4.0 (https://creativecommons.org/licenses/by-sa/4.0)]).

El Niño conditions are categorized by unusually warm and nutrient poor waters, typically in the Pacific region. DeRango and colleagues postulated that such unsuitable weather could change CSL hunting patterns, likely by pushing them further from shore resulting in larger energetic costs from the CSL. Likewise, for the adult male CSL during peak breeding season they would cease hunting to concentrate on the arduous breeding tenure.

To conduct the study, blood samples were taken from juvenile and adult CSL during October 2015/ October 2016 and March 2016/ August 2016 respectively (Figure 2). From the blood samples they analyzed stress hormones, glucose levels, thyroid hormones, immune markers and interactions between the HPA (hypothalamus, pituitary gland, and adrenals glands) axis; which they hypothesized would all be suppressed. However, the results were a bit different from expected:

  1. From 2015 to 2016 the glucose and stress hormone levels for juvenile and adult male CSL decreased.
  2. From 2015 to 2016 the thyroid hormones for juvenile and adult male CSL increased
  3. From 2015 to 2016 immunoglobin increased in juveniles but decreased for adult male CSL after breeding.

Figure 2: Timeline of events for the research of CSL. Types of CSL sampled: JUV = Juvenile, Ad M = Adult Male. Locations where CSL were sampled: ANI = Año Nuevo Island, California and Astoria, Oregon. (DeRango et al. 2019)

So, what do the results mean? The authors interpreted these trends as follows:

  1. From 2015 to 2016 the glucose and stress hormone levels for juvenile and adult male CSL decreased:

Since the juvenile sea lions had been facing chronic stress due to lack of food and the adult male sea lion due to sustained breeding period, they animals may have been unable to mount a normal stress response to the handling and drawing of blood. Additionally, due to a lack of nutrients for juvenile seals and the extremely energetically expensive reproductive process glucose (an important energy in organisms) decreased.

2. From 2015 to 2016 the thyroid hormones for juvenile and adult male CSL increased

To support energy intensive activities like hunting and breeding, thyroid function to increase during stressful activities like breeding and foraging. This may occur since the CLS were fasting, for aforementioned reasons, thus the stress hormone may not have had the same impact of suppression on the thyroid hormone as usual.

3. From 2015 to 2016 immunoglobin increased in juveniles but decreased for adult male CSL after breeding.

Immunoglobin, which is a markers for immune system cells, increased in juveniles likely due to greater exposure to pathogens, which would increase during El Niño events. However, immunoglobin decreased for adult male CSL, because reproduction and energetic limitations caused immunosuppression.

Looking to the future, this study has shown the impact of climate change on life history events and on the CSL population – this has contributed to an understanding of the marine mammal stress response to capture, and could help to create better research protocol for the CSL in the future.

Works cited

DeRango EJ, Prager KC, Greig DJ, et al (2019) Climate variability and life history impact stress, thyroid, and immune markers in California sea lions (Zalophus californianus) during El Niño conditions. Conserv Physiol 7:1–15. doi: 10.1093/conphys/coz010

Northward range expansion in spring-staging barnacle geese is a response to climate change and population growth, mediated by individual experience

By Gaitlyn Malone, SRC Masters Student

As climate change continues to rapidly alter environments, it is important to investigate how these changes impact the species that utilize these areas. When faced with these alterations, organisms will often have to adjust their behaviors in order to increase their survival. Animals that migrate long distances in order to meet their fitness needs are a great example of species that will often have to modify their behavior since they depend on different environments that are often far apart from one another and may change at varying rates. However, the means by which these organisms adjust can differ and there is very little knowledge about how many of these responses come about.

Figure 1: Barnacle Goose (Source: Dr. Raju Kasambe, Wikimedia Commons)

A recent study investigated how an increasing population of barnacle geese (Branta leucopsis) responded to the environmental changes occurring within their two spring-staging areas located in Helgeland and Vesterålen, Norway (Tombre et al. 2019). The southernmost staging area, located in Helgeland, had been traditionally used by the barnacle geese, however since the mid-1990s, an increasing number of geese had started to stage in Vesterålen, located 250 km north of Helgeland. From 1975 until 2017, the authors collected information on goose population numbers as well as weather conditions in order to determine the extent to which these characteristics contributed to the alteration in staging area use by both new recruits in the population and older individuals that altered their migratory strategy at a later stage in life. To determine whether climate change was a contributing factor to the diversity in population distribution, the authors estimated foraging conditions at both locations to see if differences in food conditions as well as increasing competition over resources due to population growth led to the change in staging area use.

Figure 2: Spring migrations routes and staging areas of barnacle geese (Source: Tombre et al. 2019)

Through their work, it was determined that while there was enhanced grass growth in Helgeland, the condition of foraging materials remained stable over time. However, in Vesterålen production of digestible materials increased, leading the authors to believe that the changing conditions in this area contributed to the change in the barnacle geese’s range. Additionally, it was determined that the population growth at Vesterålen occurred through to two different processes. First, during the initial years of colonization and after, young geese tended to switch to Vesterålen first and comprised the highest numbers within the flock. Secondly, it was also found that while older birds had a decreased probability of switching from Helgeland to Vesterålen, over time the probability increased for all ages. These findings suggest that barnacle geese use both social learning and individual experiences to adjust in their behavior and respond rapidly to climate change. These results are one of the first to portray the role that individual decisions play in population scale patterns and add to the growing knowledge on the importance of social learning in the development of migratory behaviors.

Works cited:

Tombre IM, Oudman T, Shimmings P, Griffin L (2019) Northward range expansion in spring ‐ staging barnacle geese is a response to climate change and population growth , mediated by individual experience. 1–14. doi: 10.1111/gcb.14793

The Negative Effects to Prevalent Plastic Pollution

By Delaney Reynolds, SRC intern

Plastic pollution has become one of the largest adverse impacts on marine life to date. In the last 70 years, plastic debris has become so prominent in layers of sedimentary deposits that it can be used as a primary indicator for the Anthropocene, a human-induced geological epoch (Puskic, et al. 2019). While plastic does technically break down, it only fragments into micro- and nano-plastics and thus never leaves the environment completely. These miniscule particles are commonly consumed by marine animals of all sizes ranging from plankton to whales. Seabirds such as albatross, petrels, and shearwaters have been found to have very high plastic ingestion rates due to their foraging strategies, as well as its various colors and odors that they find attractive. Ingesting plastic debris causes damage to lipid-derived fatty acids (FAs). FAs are warehoused in a variety of tissues for energy storage. Adipose tissues, connective tissue that also stores energy in the form of fat, contains triglycerides (TAG), main constituents in body fats, which are a vital energy source for juvenile birds.

Figure 1: Plastic pollution in Guanyin District, Taiwan (Source: Henry & Co. on Unsplash: https://unsplash.com/photos/cZpvuwwQQg0)

Researchers from the Institute for Marine and Antarctic Studies at the University of Tasmania explored how FA analysis could be used to investigate the impacts of seabird plastic ingestion on seabirds’ health. Roadkill or beach-washed deceased flesh-footed shearwater and short-tailed shearwater fledglings were collected on Lord Howe Island, New South Wales, Australia. Their body mass, wing length, and head + bill length were measured and plastic debris less than one millimeter in size were weighed. Adipose tissues were collected from breasts and FAs were extracted and analyzed with several statistical tests. The average number of plastic debris ingested was found to be 4.47 pieces weighing approximately 0.0760 grams for short-tailed shearwaters. The average number of plastic debris ingested was found to be 18.44 pieces weighing approximately 2.9277 grams for flesh-footed shearwaters. Although the research did not find a significant relationship between the mass of plastic, number of plastic debris present, and body mass, 37 different FAs were found in liver and muscle tissues between both species (Puskic, et al. 2019).

Figure 2: Differences in fatty acids between flesh-footed shearwater and short-tailed shearwater seabirds (Source: Puskic et al. 2019).

Discrepancies found between the FAs identified in the different species of shearwaters may be attributed to the turnover rate of FAs and lipid classes specific to tissues. The study concluded that flesh-footed and short-tailed shearwaters are, indeed, two distinct groups of one species based on FA composition. The FA composition of prey species likely drives the difference, as flesh-footed shearwaters are known to feed on mesopelagic fish and squid and short-tailed shearwaters are known to feed on krill and small cephalopods. These two different classes of prey have dramatically different FA levels, and this was found to be reflected in the FA outputs of the two different shearwaters.

Based on this study, fatty acid analysis can be used to explore how plastic pollution disrupts nutritional pathways and it was found that within the sample of shearwaters collected, there was no effect. These types of studies and tools will be imperative for use to manage and analyze the current and future effects of plastics on other species, especially marine, as anthropogenic-driven plastic pollution continues to become more prevalent in our world.

Works Cited:

Puskic, Peter S, et al. “Uncovering the Sub-Lethal Impacts of Plastic Ingestion by Shearwaters Using Fatty Acid Analysis.” Conservation Physiology, Oxford University Press, 16 May 2019, academic.oup.com/conphys/article/7/1/coz017/5489824.

Endangered Atlantic Sturgeon in the New York Wind Energy Area: implications of future development in an offshore wind energy site

By Enzo Newhard, SRC intern

The environmental benefits of renewable energy sources have been well established as the “pro green” discourse emphasizes the importance of eliminating our input of greenhouse gasses into the environment. The negative impact renewable energy development may have on the environment, however, has not been as thoroughly discussed. Burning fossil fuels releases harmful gasses into the atmosphere adding to the greenhouse effect and alters global ecosystem chemistries. Renewable sources’ generally have no waste product but due to their lower efficiency the installations need to take up a much larger area. However, it is largely unknown how some of these instillations could impact the environment in which they are installed especially ones in the ocean. A paper by Evan Corey Ingram, Robert M. Cerrato, Keith J. Dunton, and Michael G. Frisk, titled Endangered Atlantic Sturgeon in the New York Wind Energy Area: implications of future development in an offshore wind energy site, lays the groundwork for assessing the disturbances the development of an offshore wind farm may have on local populations of Atlantic Sturgeon.

The Atlantic Sturgeon is an endangered anadromous fish which is the species of concern for this paper as it is believed to be present in the waters slotted for the development of the New York Wind Energy Area (NY WEA). 133 Atlantic Sturgeon were caught and fitted with acoustic transmitters to record and track their movements in the WEA. Sturgeon were regularly detected throughout the study period except from July-September when abundance was low. Both temporal and spatial variations in their distribution were observed with the majority of detections occurring at the nearshore receivers except for periods of high abundance where the fish seemed more uniformly distributed throughout the WEA (Ingram et. al. 2019).

Figure 1. “Detection count (top panel) and unique transmitter count (bottom panel) of Atlantic Sturgeon detected on acoustic transceivers in the New York Wind Energy Area study site (Equinor, Lease OCS-A 0512). Transceivers are represented by increasing distance from shore; note that intervals are not equal.” (Source: Ingram et al. 2019)

Most of the research regarding sturgeon stocks has been done in riverine and estuarine environments, information about their population dynamics and foraging ecology in marine environments is largely unknown. This study provided a valuable baseline of sturgeon distribution and abundance in the future wind energy site and underscores the importance of long-term monitoring of offshore areas to enhance recovery efforts by locating important new habitats which have been underrepresented in current scientific literature.

Figure 2. “Monthly counts of unique Atlantic Sturgeon (represented by graduated symbols) detected at unique acoustic transceiver stations in the New York Wind Energy Area study site (Equinor, Lease OCS-A 0512) from November 2016 through January 2018. Monthly point values of average bottom temperature were compiled from transceiver metadata. The transceiver array operated throughout the entire course of the study with the exception of a single station indicated by (^) which was not recovered during the final download cruise; data for this station were unavailable for the months of August 2017–February 2018” (Source: Ingram et al. 2019)

Work Cited

E.C. Ingram, R.M. Cerrato, K.J. Dunton, M.G. Frisk 2019. Endangered Atlantic Sturgeon in the New York Wind Energy Area: implications of future development in an offshore wind energy site. Scientific Reports 9:12432

Migrating eastern North Pacific gray whale call and blow rates estimated from acoustic recordings, infrared camera video, and visual sightings

By Bella Horstmann, SRC intern

Previously almost hunted to extinction, the North Pacific gray whale population currently inhabits the waters off the coast of California. Distinguished by their extremely long and predictable migration patterns, these animals have been observed very close to shore, making them a model species for studying population dynamics and animal abundance because of the ability to easily spot from land. During the 2014-2015 southbound migration period, a group of researchers from the National Oceanic and Atmospheric Administration (NOAA) and the Scripps Institution of Oceanography sought to understand these population dynamics and statistically estimate cue rates by using visual sightings, combined with acoustic call recordings, and infrared blow detections. Each year during December through March, these charismatic marine mammals migrate between summer feeding areas in the Bering and Chukchi Seas, and the wintering areas of the lagoons in Baja California Peninsula in Mexico. Past studies on population abundance have just included visual surveys from land or on a ship, which can be time intensive, expensive, and may introduce the confounding variable of human impact. Here, Guazzo et. al (2019) turned to autonomous techniques in hopes of revealing a more reliable and accurate methodology for population abundance estimates.

Owing to their proximity to land, North Pacific gray whales can be visually surveyed from the Granite Canyon study site, an area where the continental shelf is particularly narrow, making for simple visual detection from land. Observers stood 22 meters above sea level and recorded gray whale sightings for 34 days during December 2014 and February 2015. Additionally, four hydrophones were moored to the bottom of the ocean in different locations in between November 2014 and June 2015, and continuously collected acoustic information throughout the whole migration season. Lastly, three infrared cameras pointing at different angles offshore recorded blow detection. In Figure 1, which is a map of the study area for the combined surveys, the location of the NOAA visual observers, as well as the location of hydrophones and infrared cameras is indicated.

Figure 1. Map of study area. The black circle indicates where the visual observers stood on land. The yellow lines show the visual field of these observers. The white diamond indicates where the infrared camera, and the pink lines show the window of detection for that camera. The four black triangles indicate the locations of the four underwater hydrophones and are labelled accordingly. Color indicates elevation and depth. (Source: Guazzo et al. 2019)

Once the southbound migrating North Pacific gray whales were detected, a cue rate formula was utilized in order to get an accurate population abundance estimate. Using all of the combined methods, a population of 38,304 whales was estimated to migrate during the 2014-2015 season. The acoustic findings showed an interesting daily call rate increase from 5.7 calls/whale/day to 7.5 calls/whale/day, indicating an increase in communication during the migration season. Figure 2 shows the gray whale tracks from the visual, acoustic, and infrared localizations.

This paper is unique because it monitors population abundance using cue rates, a technique that minimizes confounding variables and human impact on the animals. Using these combined techniques also increases the accuracy of the results due to an increased sample size. This is a huge step in the world of marine mammal research, as this combined methodology can be applied to other marine mammal studies, in hopes of more accurately tracking population densities and sizes.

Figure 2. Example North Pacific gray whale tracks from combined methodology localizations. The colored circles indicate visual sightings, and the colored triangles indicate acoustic calls. Infrared blow detections are shown by the colored diamonds. The color variation indicates the amount of time in minutes since the start of the detection. As in Figure 1, the black triangles are the presence of the hydrophones, the pink lines are the infrared detection area, and the yellow lines are the visual field of the observers onshore. (Source: Guazzo et al. 2019)

Works Cited

Guazzo, R. A., Weller, D. W., Durban, J. W., Gerald, L. D., & Hildebrand, J. A. (2019). Migrating eastern North Pacific gray whale call and blow rates estimated from acoustic recordings, infrared camera video, and visual sightings. Scientific reports9(1), 1-11.

Securing Sustainable Somali Fisheries

By Peter Aronson, SRC intern

Lots of people know about the issue of piracy in Somali waters in recent years, with mass coverage from American media and even Hollywood focusing on it with the 2013 movie Captain Phillips. However, many people don’t know that the loss of secure fisheries to illegal foreign vessels was the root cause of these conflicts (Beri, 2011). In the 1980’s, when the Somali Civil War first broke out, the central government collapsed and the Somali Navy disbanded. As a result, foreign fishing boats took advantage of the lack of security and fished Somali waters heavily, leading to great erosion of fish stocks. With no government intervention to help, artisanal Somali fishermen banded together to protect their own resources. At first, violence was not threatened or used. However, as events escalated, weapons were used, both poor fishing vessels and wealthy cargo vessels were taken over, and in some cases hostages were held for ransom. As this became profitable, pirate activities became widely funded by financiers and militiamen on land. The cause of all this was illegal foreign fishing.

Illegal, unreported, and undocumented (IUU) fishing from foreign fleets declined in Somalia in the mid 2000’s due to piracy, but increased again when foreign naval fleets began patrolling Somali waters to reduce piracy (Oceans Beyond Piracy, 2014). Seeing foreign fleets off the coast angered the public and increased support for piracy, as sustainably developing artisanal and subsistence fisheries became much more difficult with pressure from foreign operations. Due to uncertainty of the legality of foreign fishing for decades, unregulated fishing with ineffective enforcement of decades-old policy, and catch that hasn’t been reported to the United Nations since 1988, there is a widespread perception that any foreign fishing activity in Somalia is illegal (Glaser et al., 2015).

Apart from poor fisheries management, there is justified anger towards foreign vessels due to violent conflict. They have been accused of hiring armed guards to shoot at Somali fishers, blasting hot water at Somalis, and destroying fishing gear in domestic artisanal fisheries (Glaser et al., 2015). Additionally, Somalis are upset at the foreign fleets’ destruction of fish stocks at the expense of domestic fishing, and using destructive methods, such as bottom trawling, that destroy coral reef and other habitat. As a result, Somalia has removed fishing rights from many foreign vessels, and have even captured vessels and imprisoned the fishermen aboard them (Glaser et al., 2015).

Using satellite data, the Secure Fisheries group with the One Earth Future Foundation estimated the amount of foreign fishing vessels in Somali waters between 1981 and 2013, and the amount of fish they took. It was estimated that 3.1 million metric tons of marine life was taken in this time frame by foreign vessels, more than twice the amount that domestic Somali fishermen took at 1.4 million metric tons. The heaviest fishing nations in the time frame are Iran, Yemen, Spain, Egypt, and France, though in 2013 Spain, Seychelles, France, South Korea, and Taiwan dominated.

Trawling has had a great impact on Somalia’s marine habitat. Trawling from foreign nations continued for decades following the collapse of Somalia’s government, with bottom trawling even continuing beyond Somalia’s ban of it in the new Somalia Fisheries Law. It was mainly Italian and Egyptian vessels trawling until 2006, when South Korean ships replaced the Italian ones. Italian and Korean vessels fished 220 and 229 days of the year respectively. Some trawlers are actually licensed to Puntland, a coastal region in Somalia on the Horn of Africa. Due to its wide continental shelf and high fish availability, as well as licensing in the region, most trawling occurred in shallow waters here. Over the time period that data was collected, 120,652 square kilometers were trawled, an area slightly larger than the neighboring nation Eritrea (Glaser et al., 2015). This doesn’t account for areas of seafloor that were trawled multiple times. Several areas that experienced this underwent significant ecosystem damage.

In Somalia, foreign fleets are larger, better equipped, and more technologically advanced, giving them a competitive edge over smaller Somali vessels. Globally there is a similar trend of large, distant, industrial fleets outcompeting small, artisanal and subsistence fishers. These small-scale fishers are some of the world’s poorest people and are extremely vulnerable to changes in resource availability (Béné, 2009). The current sustainability of fish stocks were estimated by Secure Fisheries using methods designed for data-poor fisheries. It was found that 8 of 17 fish groups analyzed are currently fished unsustainably, including swordfish, emperors, sharks, snappers, and groupers. This data must be used cautiously, as categories were analyzed at different levels, such as striped marlins at the species level, to sharks at the family level. Additionally due to little available data, estimations of migratory species used catch reconstruction and the classification of whether or not a stock was sustainable was based on comparison to an exact calculated value.

Optimistically, a lower proportion of fish stocks are being fished unsustainably in Somalia than globally, and no stocks are collapsed whereas 24% of stocks are globally. This advantage is due to delayed industrial fishing in Somali waters. However, if trends continue and follow the preceding global pattern, it is estimated that over half of Somali stocks will be overexploited by 2025 (Glaser et al., 2015). It is important to move towards sustainable fisheries in Somalia. With the full effects of postcolonialism pressing down on the nation, sustainable fisheries could promote the Somali economy, provide food, and nourish many for years to come.

Works Cited

Béné, C. (2009). Are Fishers Poor or Vulnerable? Assessing Economic Vulnerability in Small-Scale Fishing Communities. Journal of Development Studies, 45(6), 911–933. doi:10.1080/00220380902807395

Beri, R. (2011). Piracy in Somalia: addressing the root causes. Strateg. Anal., 35 (3), 452-464.

Glaser SM, Roberts PM, Mazurek RH, Hurlburt KJ, and Kane-Hartnett L (2015) Securing Somali Fisheries. Denver, CO: One Earth Future Foundation. DOI: 10.18289/OEF.2015.001

Oceans Beyond Piracy. (2014). The State of Maritime Piracy Report 2014. Denver, Colorado: One Earth Future Foundation.

The transfer of energy within a food chain: Why do large whales feed on small plankton?

By Meagan Ando, SRC intern

The ten-percent rule toward energy transfer among levels of a trophic system is one that has been used to study ecosystems’ energy dynamics for a long time. But, in order to understand it, one must have a basic understanding of a food chain (Figure 1). Food chains describe the transfer of energy from its source in plants, through herbivores, up to carnivores and onto higher order predators (Sinclair et al. 2003). These different “levels” are known as trophic levels, which is properly defined as the position within the food chain or energy pyramid that an organism can be found. But how much energy is passed along through each level? This is where the ten-percent rule comes in.

Figure 1: An example of a food chain. The first trophic level consists of primary producers gathering energy from the sun, which will be passed up to herbivores, then multiple levels of carnivores (source: nau.edu).

Food webs are often pretty short, which confused many scientists for a long time. Ever wonder why such a large whale feeds on such small planktonic organisms, such as krill? The evidence for the evolutionary advantage of this strategy lies within the definition of the ten-percent rule. When energy is passed along throughout an ecosystem from one trophic level to the next, only 10% of the energy that the first organism receives will actually be passed along. The way in which to study this phenomenon has certainly presented it’s difficulties, as it is clearly impossible to actually visualize the transfer of energy. However, the primary means for determining what marine organisms eat is to study their stomach contents, which is exactly what Reilly et al. 2004 did.

It was known that the International Whaling Commission (IWC) along with the Commission for the Conservation of Antarctic Marine Living Resources (CCAMLR) shared a common curiosity in the idea of the feeding ecology of Baleen whales. This was significantly due to their interests in efforts to place management decisions within an ecosystem context (Reilly et al. 2004). The most efficient way for them to determine their prey sources was to estimate krill consumption by various species of Baleen whales in the Southern Atlantic region during the summer feeding season in the year 2000. In order to successfully draw these estimates, inferences had to be made pertaining to how frequently the whales actually filled their stomachs. This included diurnal change in the forestomach content mass, which ended up producing estimates of 3.2-3.5% of body weight per day (Figure 2) (Reilly et al. 2004). To follow through with the energy tests, four ships participated in the survey to weigh the stomach contents of whales that were unfortunately killed for commercial or research whaling.

Figure 2: Daily consumption rates determined by the four models pertaining to various baleen whales (Humpback, Fin, Right, Sei, and Blue) (Reilly et al. 2004).

In total, 730 cetacean sightings were recorded which included 1,753 separate individuals. It was determined that 83% of the annual energy intake for the whales in this region occurred during this
120-day feeding span in the summer season. The range of total consumption was 4-6% of the standing
krill stock (Reilly et al. 2004). This percentage was derived from the fact that the initial stock included approximately 44 million tons of krill, of which the whales consumed somewhere between 1.6 million and 2.7 million tons (Reilly et al. 2004). These numbers allowed the scientists to make connections between food consumed and the total amount of energy a whale needs to carry out daily bodily functions to survive. It also allowed them to draw conclusions based on where they feed to better protect threatened animals as well as to tweak quotes set for the commercial exploitation of krill, as it is their main food source.

With all of this in mind, it still may not make sense as to why such a large animal would feed on some of the smallest organisms in the ocean. Blue whales, which can be 20-30 meters long, feed on shrimp-like krill that are a mere 2-3 centimeters long. As stated above only ten percent of the energy obtained from one trophic level gets passed along to the next trophic level. For this reason, ecosystems with longer food chains are proven to be, on occasion, less stable than those whose food chains are shorter (Sinclair et al. 2003). Therefore, it is more advantageous for the whale to eat animals on a trophic level in which there is more energy available to be taken in. Hill et al. 2018’s textbook Animal Physiology describes this concept in more depth. In it, they contrast two different possible mechanisms by which a whale can obtain food. One is for the whale to eat fish that are somewhat smaller than themselves. These fish can potentially eat fish that are slightly smaller than themselves, and so on. In this case, there are many trophic levels that the energy will have to pass through before reaching the whale. To apply the ten percent rule directly, we can say that the primary producer produces 10,000 units of energy obtained from the sun. The crustaceans that feed on the producer will generate 1,000 units of energy, from which the small fish that feeds on them will produce only 100 units of energy. The larger fish that feeds on this fish will produce only 1 unit of energy, which may not be enough to sustain the large whale. This is why Baleen whales have evolutionarily evolved into suspension feeders, using Baleen plates to take in large amounts of water and sift through to find small krill. The Baleen whales can eat organisms much smaller than themselves, which can cut down the trophic levels between primary producer and the whale itself, making the energy available to the whale population 1,000 units, as opposed to only 1. In summation, shortening the food chain will in turn increase the food energy available to the whales by a factor of 1,000 (Figure 3) (Hill et al. 2018).

Figure 3: Shorter food chains deplete the energy available to whales less that longer food chains. (Hill et al. 2018).

By better understanding the way in which whales, or any animal for that matter, obtains energy through food, we can further implement new methodologies to better protect them. For example, now that it is known that krill play an extremely important role in the survival of the Blue Whale, agencies can implement new ecological management strategies to be sure that krill populations are not significantly affected by anthropogenic impacts. They may seem like invisible creatures floating in the ocean, but to Baleen whales, they mean a whole lot more.

Works cited

Hill, Richard W., et al. 2018. Animal Physiology. Sinauer Associates/Oxford University Press. Nau.edu. “Life on the Food Chain.” The Food Chain.

Reilly, S., Hedley, S., Borberg, J., Hewitt, R., Thiele, D., Watkins, J. and Naganobu, M., 2004. Biomass and energy transfer to baleen whales in the South Atlantic sector of the Southern Ocean. Deep Sea Research Part II: Topical Studies in Oceanography, 51(12-13): 1397-1409.

Sinclair, Michael, and G. Valdimarsson. 2003. Responsible Fisheries in the Marine Ecosystem. Food and Agriculture Organization of the United Nations 8: 125-131.