Migrating eastern North Pacific gray whale call and blow rates estimated from acoustic recordings, infrared camera video, and visual sightings
By Bella Horstmann, SRC intern
Previously almost hunted to extinction, the North Pacific gray whale population currently inhabits the waters off the coast of California. Distinguished by their extremely long and predictable migration patterns, these animals have been observed very close to shore, making them a model species for studying population dynamics and animal abundance because of the ability to easily spot from land. During the 2014-2015 southbound migration period, a group of researchers from the National Oceanic and Atmospheric Administration (NOAA) and the Scripps Institution of Oceanography sought to understand these population dynamics and statistically estimate cue rates by using visual sightings, combined with acoustic call recordings, and infrared blow detections. Each year during December through March, these charismatic marine mammals migrate between summer feeding areas in the Bering and Chukchi Seas, and the wintering areas of the lagoons in Baja California Peninsula in Mexico. Past studies on population abundance have just included visual surveys from land or on a ship, which can be time intensive, expensive, and may introduce the confounding variable of human impact. Here, Guazzo et. al (2019) turned to autonomous techniques in hopes of revealing a more reliable and accurate methodology for population abundance estimates.
Owing to their proximity to land, North Pacific gray whales can be visually surveyed from the Granite Canyon study site, an area where the continental shelf is particularly narrow, making for simple visual detection from land. Observers stood 22 meters above sea level and recorded gray whale sightings for 34 days during December 2014 and February 2015. Additionally, four hydrophones were moored to the bottom of the ocean in different locations in between November 2014 and June 2015, and continuously collected acoustic information throughout the whole migration season. Lastly, three infrared cameras pointing at different angles offshore recorded blow detection. In Figure 1, which is a map of the study area for the combined surveys, the location of the NOAA visual observers, as well as the location of hydrophones and infrared cameras is indicated.
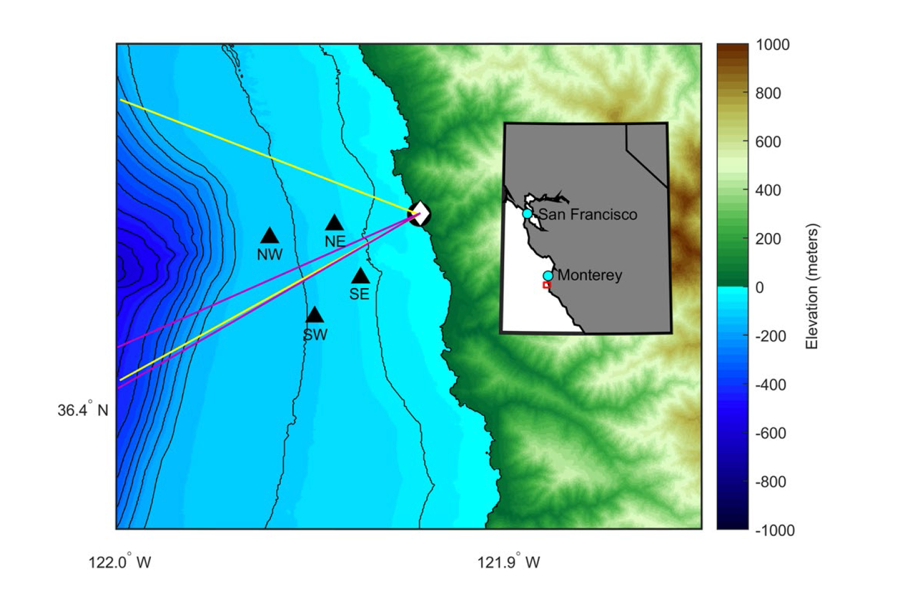
Figure 1. Map of study area. The black circle indicates where the visual observers stood on land. The yellow lines show the visual field of these observers. The white diamond indicates where the infrared camera, and the pink lines show the window of detection for that camera. The four black triangles indicate the locations of the four underwater hydrophones and are labelled accordingly. Color indicates elevation and depth. (Source: Guazzo et al. 2019)
Once the southbound migrating North Pacific gray whales were detected, a cue rate formula was utilized in order to get an accurate population abundance estimate. Using all of the combined methods, a population of 38,304 whales was estimated to migrate during the 2014-2015 season. The acoustic findings showed an interesting daily call rate increase from 5.7 calls/whale/day to 7.5 calls/whale/day, indicating an increase in communication during the migration season. Figure 2 shows the gray whale tracks from the visual, acoustic, and infrared localizations.
This paper is unique because it monitors population abundance using cue rates, a technique that minimizes confounding variables and human impact on the animals. Using these combined techniques also increases the accuracy of the results due to an increased sample size. This is a huge step in the world of marine mammal research, as this combined methodology can be applied to other marine mammal studies, in hopes of more accurately tracking population densities and sizes.
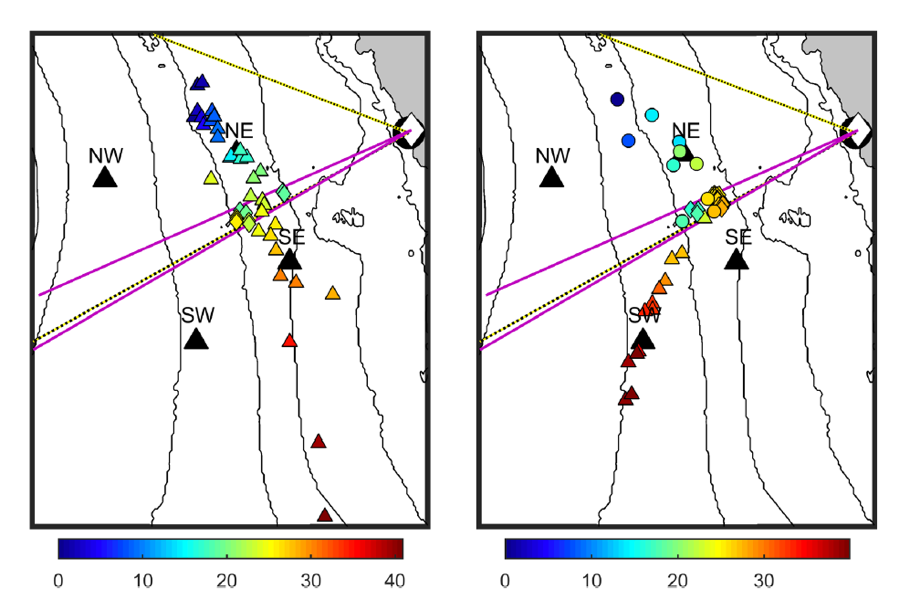
Figure 2. Example North Pacific gray whale tracks from combined methodology localizations. The colored circles indicate visual sightings, and the colored triangles indicate acoustic calls. Infrared blow detections are shown by the colored diamonds. The color variation indicates the amount of time in minutes since the start of the detection. As in Figure 1, the black triangles are the presence of the hydrophones, the pink lines are the infrared detection area, and the yellow lines are the visual field of the observers onshore. (Source: Guazzo et al. 2019)
Works Cited
Guazzo, R. A., Weller, D. W., Durban, J. W., Gerald, L. D., & Hildebrand, J. A. (2019). Migrating eastern North Pacific gray whale call and blow rates estimated from acoustic recordings, infrared camera video, and visual sightings. Scientific reports, 9(1), 1-11.