Posts

Propeller Scars in Seagrass Beds: Recovery and Management in the Chesapeake Bay

By Grant Voirol, SRC intern

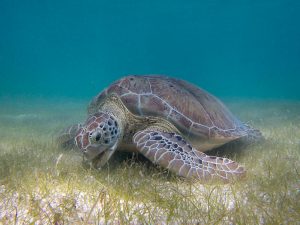
Seagrass beds may seem simple on the surface, but they provide a wide variety of ecosystem services ranging the biotic and abiotic, economical and ecological. Most importantly, seagrass beds protect against coastal erosion, recycle vital nutrients, and provide habitat and food for essential species for the ecosystem and for fisheries (Barbier et al. 2011). However, due to their proximity to cities and human development, these unsung heroes are often subjected to fragmentation via propeller scarring. Seagrasses occur in relatively shallow waters, and when boats and other vessels operate in these shallow depths, their propellers can grind up the sandy substrate and rip up the seagrass. This leaves a visible “scar” through the habitat (Figure 1).

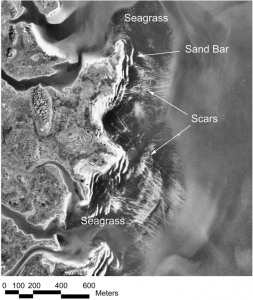
Aerial photography of Browns Bay in the Chesapeake Bay (Orth et al. 2017).

In a recent paper, Orth et al. 2017 utilized the Chesapeake Bay submerged aquatic vegetation (SAV) monitoring effort through the Virginia Institute of Marine Science to assess the degree of propeller scar damage present in the Chesapeake Bay and the impact of management decisions. This allowed these researchers to examine over 25 years of aerial photography. Most studies on propeller scars in seagrass beds can only monitor for a few months to a few years, but this multi-decade effort can examine the more long-term effects of specific anthropogenic stressors as well as recovery potential. In order to measure these qualities, researchers counted the number of new scars each year as well as the length of the scars. Additionally, preliminary results allowed for the development and implementation of management strategies that can also be observed and tested for efficacy.

The researchers found that on average during the entire study period, 112 new propeller scars were found in the Chesapeake Bay each year and that the average length of each new scar was 78.5 meters long. The time required for a propeller scar to become fully vegetated again was variable. The average was about 3 years, but the range ran from 2 to 18 years in order to recover. This shows that the Chesapeake Bay has been subjected to high levels of propeller scarring over the past few decades. The study examined the fishing industry, recreational boats, and moorings and docks as potential causes of these scarring events and concluded that the main anthropogenic sources are the fishing practices of crab scraping and haul seining. Crab scraping is when boats drag metal baskets through the seagrass beds in order to harvest molting blue crabs. Surprisingly, the physical action of the basket is not the cause of the scars, but when the net on the basket gets clogged with stray pieces of seagrass, the boat must increase its power in order to continue pulling the basket through the bed. This increase is the true cause of the uprooted seagrass. Causing more damage than crab scraping is haul seining, which is where multiple boats pull nets of up to 600 meters through the seagrass beds to harvest fish. The pulling of these nets, as well as the withdrawal of the boats carrying loads of fish, causes long scars throughout the beds.

To combat these stressors on the seagrass beds, scientists, government officials, and commercial groups held meetings to discuss the issues and possible options. The commission developed a strategy that focused on the more harmful of the two practices: haul seining. The main regulations were to limit the length of nets used, prohibit the use of two boats to drag nets, limit the distance a boat could drag a net, and requiring fishermen to report where they will fish during the following 24 hours.

Two highly damaged areas of the Chesapeake Bay were monitored in order to see the effects of these new regulations. Following implementation, Browns Bay showed a significant 90% reduction in the number of new propeller scars and an 89% reduction in total length of all scars. Poquoson Flats had a 43% reduction in the number of new scars found. While this reduction in number of scar was not statistically significant, the total length of all scars in Poquoson Flats did show a significant reduction by 57% (Figure 2).

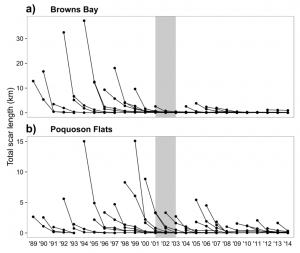
Total scar length of both a) Browns Bay and b) Poquoson Flats. Gray shaded area represents years of development and implementation of haul seining management plan (Orth et al. 2017).

Luckily for the Chesapeake Bay, a swift and scientifically based management plan could be employed that resulted in substantial improvements for the native seagrass beds. In this case, fishing activity was the main contributor to propeller scarring and not other sources. However, this is not always true. In other areas, such as the coasts of Florida and Texas, propeller scars are more often caused by recreational boat traffic, meaning that new management tactics are needed (Zieman 1976, Dunton and Schonberg 2002). Dunton and Schonberg identify the most likely cause of recreational boat damage as accidents by boaters misjudging water depth, boaters utilizing “shortcuts” through the seagrass beds, and general ignorance of the beds’ importance. In this case the best steps to move forward would be to educate the public on the importance of these communities and the harm that they may be causing as well as additional marking of channels or construction of a single channel so as to keep boat traffic confined to a single path instead of spread throughout the beds. In this way, we can keep this important ecosystem healthy and free of harmful “scar tissue”.

Works Cited

Barbier, EB, Hacker SD, Kennedy C, Koch EW, Stier AC, and Silliman BR. 2011. The value of estuarine and coastal ecosystem services. Ecological Monographs 81: 169–193.

Dunton KH, and Schonberg SV. 2002. Assessment of propeller scarring in seagrass beds on the south Texas Coast. Journal of Coastal Research SI 37: 100–110.

Orth RJ, Lefchek JS, Wilcox DJ. 2017. Boat Propeller Scarring of Seagrass Beds in Lower Chesapeake Bay, USA: Patterns, Causes, Recovery, and Management. Estuaries and Coasts 40(6):1666-1676.

Zieman, J.C. 1976. The ecological effects of physical damage from motor boats on turtle grass beds in southern Florida. Aquatic Botany 2: 127–139.

Modeling for Management: Predicting Ideal Conditions for Seagrass Habitat

By Emily Rose Nelson, RJD Intern

Seagrasses are an essential part of the marine ecosystem. They provide food, habitat, and safe nursery areas to a wide range of species. Seagrasses help to stabilize the sea floor during intense currents and storms, filter nutrients coming from land-based runoff, increase water clarity by trapping sediments, generate oxygen, and store excess carbon. Unfortunately, seagrass area is in significant decline around the world largely due to cumulative impacts of human activities such as coastal development, increasing pollution, and reckless boating. It is of utter importance that conservation and restoration efforts are put into place in order to protect seagrasses the ecosystem services they provide.

Map showing changing in seagrass area since 1879 at 205 sites along coastlines worldwide (Waycott et al., 2009).

Map showing changing in seagrass area since 1879 at 205 sites along coastlines worldwide (Waycott et al., 2009).

To date, restoration efforts have been largely unsuccessful. In order to effectively reestablish seagrass area, knowledge of the environmental factors that impact seagrass is necessary. Presence requires a number of environmental conditions including light availability, wave height, and sediment characteristics to be satisfied. Knowing this, Adams et al. have created a mathematical model to link environmental conditions to the presence or absence of seagrass.

Moreton Bay, Australia is subtropical shallow coastal embayment. There is decades of extensive data on seagrass cover and environmental conditions available for this area, making it the perfect location to use to develop this model. The model takes into account three of the most important factors in the success of seagrass: light levels (represented by mean annual benthic light availability), physical wave conditions (represented by significant wave height), and geological sediment conditions (represented by mud concentration). Looking at previous data and performing a number of mathematical manipulations established limitations for each of the three environmental factors. Seagrass will only be present when the following conditions are satisfied: annual benthic light availability is greater than 9molm-2d-1, mean significant wave height is less than 0.6m, and sediment mud concentration is less than 50%.  The study area was then divided into 100m by 100m cells and the presence or absence of seagrass was tested for each cell using the mathematical model.

Application of the model to Moreton Bay, Australia provided promising results. When compared to a real seagrass map from 2004, the model correctly predicted seagrass presence or absences at 85% of the cells. The model did even better when compared to a real seagrass map from 2011, correctly predicting 88% of the cells. Further, it is possible that some of the incorrect cells, in particular false positives, correspond to areas of opportunity for future seagrass growth.

Real seagrass observational data compared to predictions using the model developed by Adams et al. for 2004 and 2011. a, b, and c are based on seagrass observed in 2004 and d, e, and f are based on seagrass observed in 2011. a/d show the observed seagrass data, b/e show the predicted seagrass using the model, and c/f show the difference between the real observations and the model predictions.

Real seagrass observational data compared to predictions using the model developed by Adams et al. for 2004 and 2011. a, b, and c are based on seagrass observed in 2004 and d, e, and f are based on seagrass observed in 2011. a/d show the observed seagrass data, b/e show the predicted seagrass using the model, and c/f show the difference between the real observations and the model predictions.

The success of the model created by Adams et al. provides hope for combining continual monitoring with modeling as a method to determine actions needed for conservation and restoration of seagrass beds on a local level. The limiting environmental factors differ among locations and therefore different actions are needed to improve chances of seagrass survival; if the model predicts absence of seagrass at a particular spot there is an environmental reason for that. If the area does not have enough sunlight efforts should be made to improve water clarity, and thus allow more light through. If the area has intense wave conditions, actions can be put in place to weaken the physical effects of waves. Knowing a specific reason why seagrass is absent in a particular area makes it easier for policy makers to successfully manage the area.

Grunt

A school of yellow striped grunt swimming through the seagrass (photo credit: google images).

However, there are fallbacks to this model. For one, there are several other environmental variables that effect seagrass that are not taken into account. The model also does not account for interactions between seagrass abundance and the environmental conditions. It is also important to consider that management decisions, such as adding a break wall to minimize wave action, will likely affect other environmental factors indirectly. Despite some issues with this model, it does provide a start. Further work, such as adding additional environmental variables to the model, has the potential to make modeling an effective tool for restoration and conservation of seagrasses.


Reference:

Adams, M. P., Saunders , M. I., Maxwell, P. S., Tuazon , D., Roelfsema, C. M., Callaghan, D. P., et al. (2015). Prioritizing localized management actions for seagrass conservation and restoration using a species distribution model. Aquatic Conservation: Marine and Freshwater Ecosystems.

Waycott, M., Duarte, C.M., Carruthers, T.J.B., Orth, R.J., Dennison, W.C., Olyarnik, S., et al. (2009). Accelerating loss of seagrasses across the globe threatens coastal ecosystems. Proceedings of the National Academy of Sciences of the Unites States of America.

Current threats to coastal seagrass ecosystems

By Hanover Matz, RJD Intern

If asked what marine ecosystems are currently most at risk, many people would probably identify coral reefs and mangrove forests. Climate change, sea level rise, and habitat degradation are all terms that come to mind when addressing the decline of corals and mangroves worldwide. However, equally important and at risk are seagrass ecosystems. Seagrasses are marine flowering plants that form ecologically important coastal habitats in tropic and temperate oceans, playing a key role in unison with coral reefs and mangroves (Short et al., 2011). These three habitats exchange nutrients and organic matter, and seagrasses provide important habitat for many species of marine fauna and juvenile fish (van Tussenbroek et al., 2014). Endangered megafauna such as manatees, dugongs, and sea turtles graze on seagrass beds. In addition to supporting marine biodiversity, seagrass beds provide many benefits to human society. They support fisheries and provide livelihoods for millions of people in coastal communities (Short et al., 2011). Seagrass beds also maintain water quality and reduce turbidity through sediment deposition. By acting as nurseries for many economically important fish species such as snapper and grouper, they help support both tourism and fisheries (Lirman et al., 2014). Due to increasing anthropogenic threats to seagrass ecosystems, we are in danger of losing these important benefits.

A green sea turtle grazes on seagrass, an important food source for this endangered species. Photo courtesy of P. Lindgren via Wikimedia Commons

A green sea turtle grazes on seagrass, an important food source for this endangered species. Photo courtesy of P. Lindgren via Wikimedia Commons

In order to implement conservation measures, the current status of seagrass species must be established. An evaluation of the world’s seagrass species by Short et al. (2011) utilized criterion set forth by the International Union for the Conservation of Nature (IUCN) to determine the risk of extinction for each seagrass species. The IUCN uses extinction risk theory and data on population reduction and geographic range to determine the conservation status of a species, ranked as Extinct, Critically Endangered, Endangered, Vulnerable, Near Threatened, Least Concern or Data Deficient. Seagrass experts used these criteria along with data on 72 species of seagrass to determine the vulnerability of each species. Based on the results of Short et al., fifteen species of seagrass were found to be threatened (Endangered/Vulnerable) or Near Threatened, with three considered Endangered. While forty-eight seagrass species were considered Least Concern, twenty-two were considered to have declining populations. This evaluation shows that while only a few seagrass species may be currently threatened with extinction, if population trends continue, many more species may be facing significant reductions in geographic range in the future. Figure 2 below shows the number of seagrass species with declining populations across the globe. The region with the highest number of declining species, the coasts of China, Japan, and Korea, corresponds with areas of high human development.

Global distribution of declining species of seagrass (Short et al., 2011)

Global distribution of declining species of seagrass (Short et al., 2011)

Along with the IUCN Red List evaluation, the Caribbean Coastal Marine Productivity (CARICOMP) program has monitored seagrass communities in the Caribbean from 1992-2007 for changes in biomass and productivity. With data taken from 52 monitoring stations across the Caribbean, van Tussenbroek et al. (2014) assessed the impact of human activities on seagrass habitats. Forty-three percent of the seagrass communities at thirty-five of the long-term monitoring stations showed changes in biomass and productivity associated with environmental degradation. The authors indicated increased terrestrial run-off (sewage, fertilizer, and/or sediments) as the major anthropogenic influence on seagrasses in the Caribbean. Figure 3 shows the distribution of human impacted monitoring stations across the Caribbean. Like the IUCN Red List evaluation by Short et al., this study shows that we are just beginning to understand the effects human activities have had on seagrass habitats, and that these impacts will likely increase in the near future.

Distribution of seagrass community monitoring stations in the Caribbean, indicating communities potentially altered by environmental degradation (van Tussenbroek et al., 2014)

Distribution of seagrass community monitoring stations in the Caribbean, indicating communities potentially altered by environmental degradation (van Tussenbroek et al., 2014)

If seagrasses are on the decline, what is that primary cause of this decline? By combining the knowledge of several seagrass experts, Grech et al. (2012) identified many of the major threats to seagrass communities. Of the threats assessed, industrial and agricultural run-off, coastal infrastructure development, and dredging were determined to have the greatests impacts on seagrasses globally. These anthropogenic activities disturb seagrasses by increasing water turbidity and physically damaging seagrass habitat. Aquaculture development, trawling, and boat damage can also harm coastal seagrass communities. In addition to these direct human activities, climate change, sea level rise, and increasing severity of tropical storms were seen as potential risks for seagrasses (Grech et al., 2012). An example of how human activity can alter seagrass communities in South Florida was demonstrated by a study conducted in western Biscayne Bay (Lirman et al., 2014). Lirman et al. found that the proximity of the major metropolitan center, Miami, and changes in hydrology due to efforts to restore the Everglades have caused shifts in coastal salinity. These changes in turn have altered the composition of seagrass communities composed primarily of Thalassia, Halodule, and Syringodium seagrass species. Changes in salinity and nutrient availability may possibly cause the decline of seagrass dominated communities in exchange for macroalgae domianted communities. Once again, the association of human development can have serious consequences for coastal ecosystems.


In the face of all of these threats, what can be done to protect and conserve seagrasses? In an evaluation of coastal resource degradation, Wilkinson and Salvat (2012) assessed possible management solutions to help protect coral reefs, mangroves, and seagrasses. These resourcees have often been described as “commons”, open for access to anyone, but in reality these resources generally fall under the control of local coastal communities. In order to manage seagrasses, effective policies must be implemented at the local level. However, there is a disconnect between the regions of conservation research (developed nations), and the primary regions of seagrass habitat (developing nations). If seagrasses are to be protected through the use of management and Marine Protected Areas (MPAs), there must be greater cooperation between governments, policy makers, and scientists both at the national and international level (Wilkinson and Salvat, 2012). The global status of seagrass species and the current threats facing them have been established. While more research will certainly be beneficial, we need to focus on reducing the impacts of human activities. The best possible management effort will take into account all users of seagrass ecosystems, so that they can be used but not overexploited for future generations.


References


  1. Grech, A., K. Chartrand-Miller, P. Erftemeijer, M. Fonseca, L. McKenzie, M. Rasheed, H. Taylor and R. Coles (2012). “A comparison of threats, vulnerabilities and management approaches in global seagrass bioregions.” Environmental Research Letters 7(2): 024006.
  2. Lirman, D., T. Thyberg, R. Santos, S. Schopmeyer, C. Drury, L. Collado-Vides, S. Bellmund and J. Serafy (2014). “SAV Communities of Western Biscayne Bay, Miami, Florida, USA: Human and Natural Drivers of Seagrass and Macroalgae Abundance and Distribution Along a Continuous Shoreline.” Estuaries and Coasts 37(5): 1243-1255.
  3. Short, F. T., B. Polidoro, S. R. Livingstone, K. E. Carpenter, S. Bandeira, J. S. Bujang, H. P. Calumpong, T. J. B. Carruthers, R. G. Coles, W. C. Dennison, P. L. A. Erftemeijer, M. D. Fortes, A. S. Freeman, T. G. Jagtap, A. H. M. Kamal, G. A. Kendrick, W. Judson Kenworthy, Y. A. La Nafie, I. M. Nasution, R. J. Orth, A. Prathep, J. C. Sanciangco, B. v. Tussenbroek, S. G. Vergara, M. Waycott and J. C. Zieman (2011). “Extinction risk assessment of the world’s seagrass species.” Biological Conservation.
  4. van Tussenbroek, B. I., J. Cortes, R. Collin, A. C. Fonseca, P. M. Gayle, H. M. Guzman, G. E. Jacome, R. Juman, K. H. Koltes, H. A. Oxenford, A. Rodriguez-Ramirez, J. Samper-Villarreal, S. R. Smith, J. J. Tschirky and E. Weil (2014). “Caribbean-wide, long-term study of seagrass beds reveals local variations, shifts in community structure and occasional collapse.” PLoS One 9(3): e90600.
  5. Wilkinson, C. and B. Salvat (2012). “Coastal resource degradation in the tropics: does the tragedy of the commons apply for coral reefs, mangrove forests and seagrass beds.” Mar Pollut Bull 64(6): 1096-1105.